Ecommerce Site Speed: Your Conversion-First Fix Plan
A conversion-first plan for faster eCommerce pages: which Core Web Vitals matter, what to fix first and what it earns you.

Compress your hero image to under 200KB, set it to loading="eager" with fetchpriority="high", and uninstall the two or three apps you installed and forgot about. Those three moves alone will cut your LCP by a measurable margin and cost you less than a day’s work. Ecommerce sites that load in one second convert multiple times better than those loading in five seconds, and the gap between a 1.5s LCP and a 2.5s LCP shows up directly in revenue. The fastest wins are almost always the same: images are too heavy, scripts are running unchecked, and the hero element is being lazy-loaded when it should be the browser’s top priority.
Three quick wins you can ship in under 24 hours:
- Compress your hero image and convert it to WebP or AVIF. Target under 200KB for hero images, under 100KB for product thumbnails.
- Set
loading="eager"andfetchpriority="high"on the LCP image element. Do not rely on the browser to guess. - Open your platform’s app list and uninstall anything you are not actively using. Every installed app injects JavaScript even when you think it is dormant.
Never lazy-load your LCP element. It is the single most common mistake that tanks hero image LCP scores. Lazy loading tells the browser to wait before fetching the image — the exact opposite of what you want for the element Google measures as your page’s perceived load time.
Pro Tip: Run Google PageSpeed Insights on your homepage and your top-revenue product page before touching anything. Screenshot the scores. You need a baseline to prove the improvement later.
Key Takeaways
Ecommerce site speed improvements deliver the fastest ROI when you fix images and remove unused scripts first, then layer in infrastructure and frontend changes over 60–90 days.
| Point | Details |
|---|---|
| Images first, always | Compress hero images to under 200KB, convert to WebP/AVIF, and set eager loading on the LCP element before anything else. |
| Scripts are the hidden tax | Audit every installed app’s JavaScript cost; remove or defer anything that does not earn its place on each page template. |
| Core Web Vitals targets | Hit LCP under 2.5s, INP under 200ms, and CLS under 0.1 on at least 75% of real-user page loads. |
| Test before and after | Capture PageSpeed Insights field data, WebPageTest filmstrips, and conversion metrics at baseline before making any changes. |
| Vertical | Provides site audits, front-end fixes, and ongoing monitoring that connect speed improvements directly to conversion and revenue outcomes. |
Table of Contents
- What to fix first: a prioritized speed checklist
- Core Web Vitals: what the metrics mean and what to target
- How do you test site speed properly before and after changes?
- Images and media: the highest-impact optimization you can do today
- JavaScript, apps, and third-party scripts: how to audit and fix them
- CSS and fonts: stopping render-blocking before it starts
- Caching, CDN, and hosting: the infrastructure layer most stores get wrong
- Frontend UX patterns that quietly destroy your LCP score
- How do you monitor for regressions and traffic surges?
- A 30/60/90 day action plan with effort and cost estimates
- How to verify and report improvements after fixes
- Agency insight: a practical audit workflow for apps and scripts
- When should you hire an agency instead of doing it yourself?
- Vertical helps ecommerce stores load faster and convert better
- Sources
What to fix first: a prioritized speed checklist
Not every fix delivers equal return. The order below reflects impact-to-effort ratio, not alphabetical convenience. Do the top items first, even if the bottom items feel more interesting technically.
- Image optimization — compress, convert to WebP/AVIF, resize to display dimensions before upload, and set correct loading attributes on the LCP element.
- App and third-party script audit — identify which scripts run on which pages, measure their main-thread cost, and remove or defer anything that does not earn its keep.
- LCP element treatment — confirm the hero image or heading is preloaded, not lazy-loaded, and that the server delivers it fast (check TTFB).
- Critical CSS — inline above-the-fold styles, defer non-critical CSS, and remove unused rules.
- Font loading — preload the primary typeface, use
font-display: swap, and subset fonts to the characters you actually use. - Caching and CDN — verify browser caching headers are set correctly and that a CDN is serving your static assets.
- Server-side and hosting — check TTFB; if it exceeds 600ms consistently, the problem is upstream of everything else.
| Fix category | Impact on Core Web Vitals | Effort | Typical time to implement |
|---|---|---|---|
| Image compression and format conversion | LCP, CLS | Low | 2–4 hours |
| LCP element eager load and preload | LCP | Low | 30 minutes |
| App/script audit and removal | INP, TBT, LCP | Medium | 4–8 hours |
| Critical CSS and unused CSS removal | LCP, render blocking | Medium | 4 hours |
| Font preload and font-display swap | LCP, FOIT/FOUT | Low | 1–2 hours |
| CDN configuration and cache headers | LCP, TTFB | Medium | 2–6 hours |
| Hosting upgrade or server tuning | TTFB, LCP | High | 1–5 days |
| Theme rebuild or section reduction | LCP, CLS, INP | High | 1–4 weeks |
Shopify’s performance guidance confirms that images, apps, and theme complexity are the three biggest bottlenecks — and that image cleanup and app removal are the highest-impact early wins. That ordering holds across platforms, not just Shopify.
Core Web Vitals: what the metrics mean and what to target
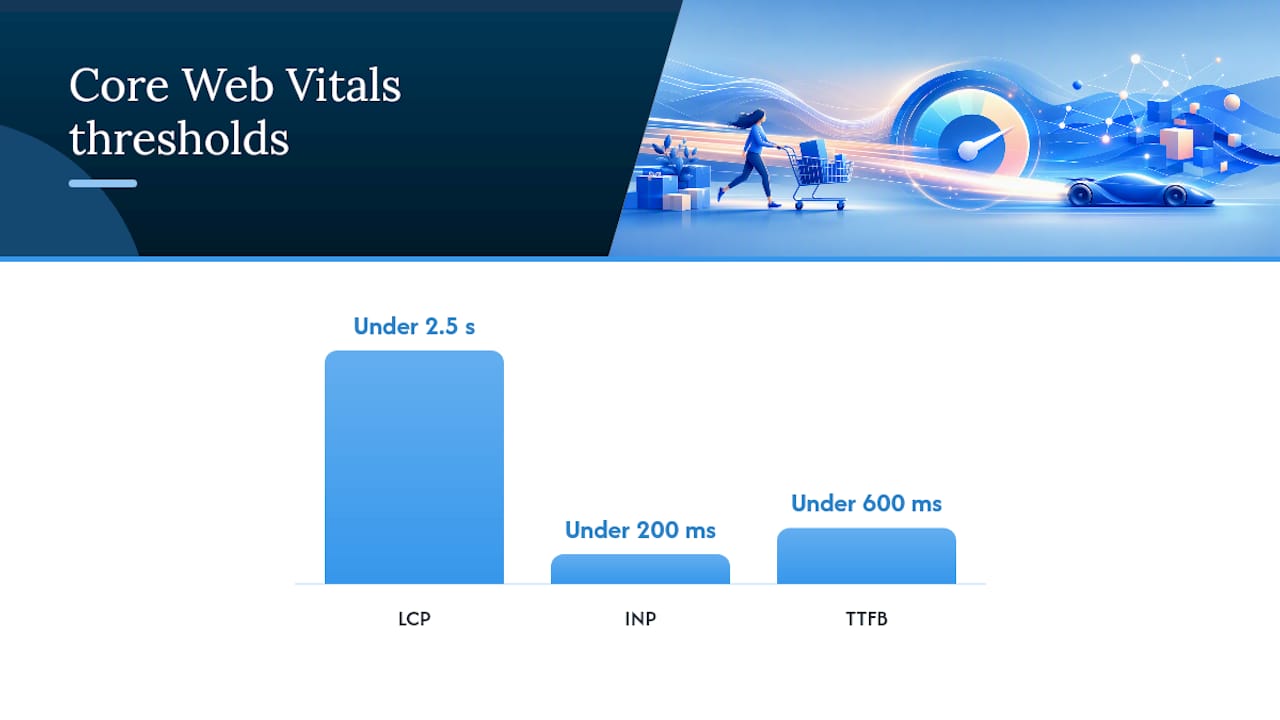
Google uses three Core Web Vitals to assess page experience: LCP, INP, and CLS.
LCP (Largest Contentful Paint) measures how long it takes for the biggest visible element to render. For most ecommerce pages, that element is the hero image or a large product photo. Google’s “good” threshold is under 2.5 seconds. Failures here are almost always caused by uncompressed images, a slow server response, or a render-blocking resource sitting in front of the image request.
INP (Interaction to Next Paint) replaced FID as the interaction metric and is harder to pass. It scores the worst interaction across the entire session, not just the first click. Product pages often fail INP because chat widgets, review widgets, and personalization scripts block the main thread at exactly the moment a customer clicks “Add to Cart” or switches a product variant. The “good” threshold is under 200ms.
CLS (Cumulative Layout Shift) scores unexpected layout movement. On ecommerce pages, the usual culprits are images without explicit width and height attributes, late-loading banners, and cookie consent bars that push content down. The “good” threshold is under 0.1.
| Metric | Good threshold | Common ecommerce cause | Primary fix |
|---|---|---|---|
| LCP | Under 2.5s | Uncompressed hero image, slow TTFB | Compress image, preload, CDN |
| INP | Under 200ms | Third-party scripts blocking main thread | Defer/remove heavy scripts |
| CLS | Under 0.1 | Images without dimensions, late banners | Set width/height, reserve space |
| TTFB | Under 600ms | Slow server, no CDN, uncached responses | CDN, hosting upgrade, caching |
For technical SEO and Core Web Vitals to work together, you need both the field data (what real users experience) and lab data (what a controlled test shows). PageSpeed Insights gives you both. Lighthouse gives you lab data only, which is useful for debugging but not for understanding real-world performance.
Which tool reports which metric:
- PageSpeed Insights — field data (Chrome User Experience Report) plus lab data; use this for your primary before/after measurement.
- Lighthouse — lab data only; use this in development and CI pipelines to catch regressions before they ship.
- WebPageTest — advanced waterfall, filmstrip, and multi-location testing; use this to diagnose specific bottlenecks and compare geographic performance.
- Chrome DevTools Performance panel — trace-level debugging; use this when you need to identify exactly which script is blocking the main thread.
- RUM providers (e.g., SpeedCurve, Calibre, or the web-vitals.js library) — real user data at scale; use these for ongoing monitoring after fixes are deployed.
How do you test site speed properly before and after changes?
A before/after comparison is only valid if you test the same pages, on the same device profiles, under the same network conditions, at the same time of day. Skipping this step means you cannot tell whether an improvement came from your fix or from a quieter server at 2 AM.
Step-by-step test methodology:
- Select your test pages. At minimum: homepage, top-revenue product page, collection/category page, and checkout. These pages have different asset profiles and different script loads.
- Set your device and network profile. Use a mid-range Android device or Lighthouse’s “Mobile” preset (Moto G Power equivalent, 4G throttled). Desktop scores are less predictive of real-user experience for most ecommerce stores.
- Run PageSpeed Insights on each URL and record LCP, INP, CLS, TTFB, and total blocking time. Screenshot the full report.
- Run a WebPageTest filmstrip from a location close to your primary customer base. Save the waterfall and the filmstrip screenshots.
- Run Lighthouse in Chrome DevTools in incognito mode (to avoid extension interference) and export the JSON report.
- Record baseline numbers in a spreadsheet: LCP, INP, CLS, TTFB, total page weight (KB), and JavaScript main-thread blocking time (ms).
- Make one change at a time where possible. Bundling multiple fixes makes it impossible to attribute the improvement.
- Re-run the same tests on the same pages after each change and compare against baseline.
What to capture for reporting:
- LCP, INP, CLS scores (before and after, field and lab)
- TTFB from at least two geographic locations
- Total page weight in KB and number of requests
- JavaScript main-thread blocking time (from Lighthouse or WebPageTest)
- Filmstrip screenshots showing visual progress at 1s, 2s, and 3s
- Conversion rate and bounce rate from your analytics platform for the same pages
EcomHint’s 2026 checklist specifically recommends testing on real mid-range Android devices for the most realistic mobile performance picture. Emulated throttling in Lighthouse is useful but tends to be slightly optimistic compared to a physical device on a real 4G connection.
Images and media: the highest-impact optimization you can do today
Images are typically the largest payload on any ecommerce page, and they are almost always the first place to look when LCP is failing. A hero image that arrives at 1.2MB is going to produce a slow LCP regardless of how well everything else is configured.

The fix sequence is straightforward: compress first, convert to WebP or AVIF second, resize to the actual display dimensions third. Uploading a 3000px-wide image and letting CSS scale it down to 600px wastes bandwidth on every single page load. Most image editing tools and CDN-based image transformation services handle this automatically once configured.
| Image type | Target file size | Recommended format | Loading attribute |
|---|---|---|---|
| Hero / banner | Under 200KB | WebP or AVIF | loading="eager" + fetchpriority="high" |
| Product thumbnail | Under 100KB | WebP or AVIF | loading="lazy" |
| Product detail (zoom) | Under 300KB | WebP or AVIF | loading="lazy" |
| Background / decorative | Under 50KB | WebP or SVG | CSS background, no <img> tag |
Responsive images and srcset: Use the srcset attribute to serve different image sizes to different screen widths. A mobile visitor should not download a 1400px-wide image. Most modern ecommerce platforms support this natively, but check whether your theme is actually implementing it or just serving one size to everyone.
Video best practices on product pages:
- Never autoplay video without
mutedandplaysinlineattributes — autoplaying video with audio is a CLS and UX problem simultaneously. - Use a static poster image so the video area renders immediately while the video file loads.
- For embedded third-party players (YouTube, Vimeo), use a lite embed or facade pattern: show a thumbnail and load the full player only when the user clicks. This alone can save 400–600KB of JavaScript on pages with embedded video.
DebugBear’s Shopify analysis identifies hero images and heavy carousels as the most common causes of slow perceived performance, even on stores where the Lighthouse score looks acceptable. The discrepancy usually comes from how the LCP element is being loaded — eager versus lazy makes a larger difference than most merchants expect.
Pro Tip: Use Chrome DevTools’ Network panel filtered to “Img” and sort by size. The top row is almost always the problem. Fix that one image before touching anything else.
JavaScript, apps, and third-party scripts: how to audit and fix them
The real bottleneck on most ecommerce stores is not the number of apps installed — it is the uncontrolled JavaScript those apps inject into every page, regardless of whether that page needs the script. A live chat widget loading on a product page makes sense. The same widget loading on the checkout confirmation page, blocking the main thread while a customer tries to click “Continue Shopping,” does not.
Audit workflow:
- Open Chrome DevTools, go to the Coverage tab, and load the page. This shows which JavaScript is loaded but never executed on that page.
- Open the Performance panel, record a page load, and look at the “Bottom-Up” and “Call Tree” tabs to identify which scripts consume the most main-thread time.
- Open the Network tab, filter by JS, and sort by size. Note every third-party domain making requests.
- Cross-reference each script against your installed app list. If you cannot identify who owns a script, it is a red flag.
- Score each script: business value (1–5) versus performance cost in main-thread milliseconds (1–5). Scripts with low business value and high performance cost are removal candidates.
Remediation tactics:
- Defer non-critical scripts using the
deferattribute. Scripts that do not need to run before the page is interactive should never block parsing. - Load on interaction for widgets like chat, reviews, and social share buttons. Load the script only when the user hovers or clicks the trigger element.
- Scope scripts to page templates. A size-chart app only needs to load on product pages. A blog-comment widget has no business on the checkout page.
- Use
asyncfor analytics and tracking scripts that do not depend on DOM readiness. - Remove, do not just disable. A disabled app on Shopify may still inject its script tag into the theme.
Questions to ask any app vendor before installing: Does this script load on every page or only where the feature is active? What is the typical main-thread impact? Is there a lightweight embed option? Can it be loaded asynchronously?
For product page INP specifically, the most common offenders are review widgets, personalization engines, and chat tools that initialize on page load and compete with the add-to-cart button for main-thread access.
CSS and fonts: stopping render-blocking before it starts
CSS is render-blocking by default. The browser will not paint anything until it has downloaded and parsed every stylesheet in the <head>.
Critical CSS strategy: Extract the styles needed to render above-the-fold content and inline them directly in the <head>. Everything else loads asynchronously. Tools like PurgeCSS identify unused rules across your templates, and most modern build pipelines support critical CSS extraction automatically. For Shopify, this often means auditing the theme’s base stylesheet and removing styles tied to sections you are not using.
| CSS issue | Symptom | Fix |
|---|---|---|
| Large monolithic stylesheet | High render-blocking time in Lighthouse | Split critical vs non-critical; inline critical |
| Unused CSS rules | Lighthouse “Remove unused CSS” warning | Run PurgeCSS or equivalent; remove unused theme sections |
| Late-loading stylesheets | CLS from unstyled content shifting | Preload critical stylesheets; defer decorative ones |
| Unminified CSS | Larger file size than necessary | Minify in build pipeline or via platform settings |
Font loading strategies:
- Preload your primary typeface with
<link rel="preload" as="font">in the<head>. This tells the browser to fetch it early, before it discovers the font reference buried in a stylesheet. - Use
font-display: swapto show fallback text immediately while the custom font loads. This eliminates Flash of Invisible Text (FOIT), which contributes to both poor LCP and a jarring user experience. - Subset your fonts. If your store uses Latin characters only, you do not need the full Unicode range. A subsetted WOFF2 file can be 60–80% smaller than the full version.
- Variable fonts consolidate multiple weights into one file. If your design uses three or four font weights, switching to a variable font typically reduces total font payload significantly.
Quick check: open the Network tab, filter by “Font,” and look at file sizes and load timing. Any font file over 50KB is worth investigating.
Caching, CDN, and hosting: the infrastructure layer most stores get wrong
A CDN does one thing extremely well: it puts your static assets (images, CSS, JavaScript) on servers physically close to your customers. Instead of a visitor in Manchester waiting for assets to travel from a data center in Virginia, they get them from a London edge node in milliseconds. Cloudflare’s documentation explains this clearly: CDNs reduce latency by serving cached content from points-of-presence closer to users, which directly lowers TTFB and improves LCP for international audiences.
What to configure:
- Browser caching headers: Set
Cache-Control: max-ageon static assets. Images, fonts, and CSS files that rarely change should have long cache lifetimes (one year is common). JavaScript files that change with deployments should use content-hash filenames so they can also be cached long-term without serving stale code. - CDN cache warming: Before a major sale or campaign, pre-populate CDN edge caches by crawling your key pages. A cold CDN cache on Black Friday means the first wave of visitors gets slow responses.
- Proxy caching for HTML: On platforms that support it, caching the HTML response at the CDN layer (not just assets) dramatically reduces TTFB. This requires careful configuration to avoid serving cached personalized content to the wrong user.
Hosting checks that matter:
- Measure TTFB from multiple locations using WebPageTest. A TTFB consistently above 600ms points to a server-side problem that no amount of image compression will fix.
- Managed ecommerce platforms (Shopify, BigCommerce) handle CDN and baseline caching for you. Custom builds on shared hosting often do not, and the performance gap is significant.
- If TTFB is high on a custom stack, check database query times, uncached server-side rendering, and whether your server is geographically close to your primary customer base.
| Infrastructure layer | What it fixes | When to prioritize |
|---|---|---|
| CDN (global PoPs) | LCP for international visitors, TTFB | Always; non-negotiable for stores with global traffic |
| Browser cache headers | Repeat-visit load time, bandwidth | Early; low effort, high repeat-visitor impact |
| CDN cache warming | First-visitor speed during traffic spikes | Before campaigns, sales events |
| Hosting upgrade | TTFB, server capacity under load | When TTFB exceeds 600ms consistently |
Frontend UX patterns that quietly destroy your LCP score
Some of the most common ecommerce design choices are also the most expensive from a performance standpoint. Hero banners, full-width carousels, and autoplaying media look impressive in a design mockup and cause measurable LCP failures in production.
| UX pattern | Performance problem | Lightweight alternative |
|---|---|---|
| Full-width hero with large image | LCP offender if image is uncompressed or lazy-loaded | Compressed WebP hero, eager load, fetchpriority high |
| Autoplay video hero | Large file, CLS risk, blocks LCP | Static image hero with play button; load video on click |
| Multi-slide carousel on load | Multiple large images fetched; JS carousel library adds TBT | Static hero with CSS-only slide or single featured image |
| Infinite scroll on collection pages | CLS as new items inject into DOM; poor Lighthouse scores | Traditional pagination or “Load More” button |
| Too many theme sections on homepage | DOM complexity, render work, CSS bloat | Fewer sections; reusable, lightweight section components |
Hero banners are the most common LCP offender on ecommerce homepages. The fix is not to remove them — it is to treat the hero image as the highest-priority asset on the page. Compress it, convert it to WebP, and tell the browser explicitly that this image matters with fetchpriority="high". A well-optimized hero image at 180KB with eager loading will outperform a 900KB hero with lazy loading every time.
Carousels present a different problem. Most carousel implementations load all slides on page load, which means the browser fetches three to five large images even though the visitor only sees one. The fix: load only the first slide eagerly, lazy-load the rest, and consider whether the carousel is delivering enough conversion value to justify its performance cost. Many A/B tests show static hero images converting as well as or better than carousels.
Pagination versus infinite scroll: Infinite scroll sounds better for engagement, but it creates CLS as new product cards inject into the DOM and push existing content around. Traditional pagination keeps LCP and CLS scores clean and is easier for search engines to crawl. A “Load More” button is a reasonable middle ground.
DebugBear’s analysis notes that heavy carousels are often the true cause of slow perceived performance even when other metrics look acceptable — because the carousel JavaScript initializes during the critical rendering window.
How do you monitor for regressions and traffic surges?
Fixing speed once is not enough. Every theme update, every new app install, and every marketing campaign that drives a traffic spike is an opportunity for performance to regress. A monitoring stack catches problems before customers do.
Recommended monitoring setup:
- RUM for Core Web Vitals — deploy the
web-vitals.jslibrary or a RUM provider like SpeedCurve or Calibre to collect real LCP, INP, and CLS data from actual visitors. Set alerts for when the 75th percentile LCP exceeds 2.5s. - Synthetic monitoring — schedule automated Lighthouse or WebPageTest runs against your key pages daily. This catches regressions that RUM might take days to surface because it requires real traffic.
- CI performance gates — run Lighthouse in your CI pipeline before any theme or code change ships. Set a budget: if LCP increases by more than 200ms or total blocking time exceeds a threshold, the build fails.
- Alert triggers to configure: LCP above 3s (field data), INP above 300ms, CLS above 0.25, TTFB above 800ms, and total page weight above a defined threshold.
Traffic surge checklist (before a major campaign or sale):
- Warm CDN caches by crawling key pages 24 hours before the event.
- Disable or throttle non-critical scripts (exit-intent popups, chat widgets, personalization) during peak hours.
- Confirm your hosting plan can handle the expected concurrent user load; scale up in advance if needed.
- Run a synthetic test from multiple locations the morning of the event to confirm baseline performance.
- Have a rollback plan for any theme changes deployed close to the event date.
Combining RUM with synthetic checks is the approach EcomHint’s best-practices guide recommends for preventing regressions after theme or app changes. Synthetic monitoring tells you what changed; RUM tells you whether real users noticed.
A 30/60/90 day action plan with effort and cost estimates
| Task | Owner | Effort | Cost band | Timeline |
|---|---|---|---|---|
| Compress and convert all images to WebP | In-house / contractor | Low | Free to low | Days 1–7 |
| Set eager load and fetchpriority on LCP elements | Developer | Low | Free | Days 1–3 |
| App audit: remove unused apps | In-house | Low | Free | Days 1–5 |
| Baseline speed test and reporting setup | In-house / agency | Low | Free | Days 1–7 |
| Defer non-critical scripts and scope per page | Developer | Medium | Low | Days 8–30 |
| Critical CSS extraction and unused CSS removal | Developer | Medium | Low to medium | Days 15–30 |
| Font preload and font-display swap | Developer | Low | Free | Days 8–10 |
| CDN configuration and cache header audit | Developer / DevOps | Medium | Low to medium | Days 15–30 |
| Theme section audit and reduction | Developer | Medium | Medium | Days 30–60 |
| Load-on-interaction for chat and review widgets | Developer | Medium | Low | Days 30–60 |
| RUM and synthetic monitoring setup | Developer / agency | Medium | Low to medium | Days 30–60 |
| Hosting upgrade or server tuning | DevOps / agency | High | Medium to high | Days 45–55 |
| Frontend rebuild or theme migration | Developer / agency | High | High | Days 60–90 |
| CI performance gating and regression alerts | Developer | Medium | Low | Days 60–90 |
Quick wins versus rebuild decisions: If your LCP is above 4s and your theme has 20+ sections on the homepage, a full theme rebuild will deliver more lasting improvement than incremental fixes. But a rebuild takes weeks and carries risk. Start with the 30-day quick wins regardless — they reduce the baseline and make the rebuild easier to scope.
DIY versus hire: If your team includes a developer comfortable with Chrome DevTools and Lighthouse, the first 30 days are entirely manageable in-house. The 60-day and 90-day tasks, particularly server-side tuning and CI gating, benefit from specialist experience.
How to verify and report improvements after fixes
Verification is not optional. Without before/after data, you cannot prove the fix worked, cannot justify further investment, and cannot catch a regression that partially reversed your gains.
Step-by-step verification process:
- Re-run PageSpeed Insights on every page you tested at baseline. Record field and lab scores.
- Re-run WebPageTest from the same location and device profile as your baseline run. Export the filmstrip.
- Pull conversion rate, bounce rate, and average order value from your analytics platform for the same pages, comparing the same time period before and after the fix.
- Compare JavaScript main-thread blocking time and total page weight against baseline numbers.
- Check TTFB from at least two geographic locations.
Attributing conversion lift to speed: Speed improvements and conversion lifts are correlated, not always directly causal in isolation. The cleanest attribution method is an A/B test where one variant runs the optimized page and the control runs the original. If an A/B test is not feasible, use a before/after comparison with the same date range from the prior year (accounting for seasonality) and note the correlation explicitly in your stakeholder report rather than claiming direct causation.
Include filmstrip screenshots in stakeholder reports. A visual showing the page rendering at 1s, 2s, and 3s before and after is more persuasive than a number to most non-technical stakeholders. Pair it with the conversion rate change and the revenue implication, and the business case for continued investment becomes obvious.
For a complete picture of website KPIs and how to measure success beyond speed metrics alone, tracking bounce rate, session duration, and AOV alongside Core Web Vitals gives you the full conversion story.
Agency insight: a practical audit workflow for apps and scripts
The audit workflow Vertical uses with clients starts with a discovery phase before any fixes are touched. Jumping straight to “remove this app” without understanding its business function leads to broken features and frustrated merchants.
Discovery checklist:
- List every installed app and its stated purpose.
- Open Chrome DevTools Network tab, filter by JS, and record every third-party domain making requests on the homepage and product page.
- Run the Coverage tab to identify JavaScript loaded but not executed on each page template.
- Run a Performance trace and record main-thread blocking time per script.
- Note which scripts load on every page versus only on specific templates.
Scoring table for prioritization:
| Script / app | Business value (1–5) | Performance cost (1–5) | Decision |
|---|---|---|---|
| Live chat (all pages) | 3 | 4 | Load on interaction only |
| Review widget (product page) | 5 | 3 | Scope to product pages; defer |
| Exit-intent popup (all pages) | 2 | 4 | Remove or scope to cart only |
| Analytics (all pages) | 5 | 2 | Keep; load async |
| Abandoned cart email trigger | 4 | 2 | Keep; verify async load |
| Unused loyalty app | 1 | 3 | Remove |
A single script removal can move LCP by 300–500ms when that script was initializing during the critical rendering window. The pattern is consistent: a merchant installs a popup tool during a campaign, the campaign ends, the app stays installed, and the script keeps loading on every page indefinitely. An audit surfaces this in under an hour.
The most expensive line in your theme is the one you forgot you added. Uncontrolled JavaScript from dormant apps is the hidden tax on every page load — and it compounds with every new install.
Vertical prioritizes fixes by conversion impact first, not Lighthouse score. A 200ms LCP improvement on the homepage matters less than a 150ms INP improvement on the product page add-to-cart button, because the latter is directly in the purchase path.
When should you hire an agency instead of doing it yourself?
The honest answer depends on three variables: your team’s technical capacity, the complexity of your performance debt, and how much revenue is at stake per month.
Hire an agency when:
- Your LCP is above 4s and your theme has significant technical debt (many sections, legacy apps, custom JavaScript).
- Your team does not include a developer comfortable with Chrome DevTools, Lighthouse, and server configuration.
- Monthly revenue is high enough that a 10–15% conversion lift from speed improvements would pay for the engagement within 60–90 days.
- You need a rollback plan and accountability for changes made to a live production store.
Handle it in-house when:
- Your performance issues are primarily image-related (the most common scenario) and your developer can run through the image checklist in a day.
- You are on a managed platform like Shopify and the fixes are theme-level rather than infrastructure-level.
- You have the time to work through the 30-day checklist methodically and the patience to test before and after each change.
Questions to ask any agency or contractor before hiring:
- What does your audit deliverable include, and can I see an example?
- How do you measure success, and what metrics will you report?
- What is your rollback plan if a change causes a regression on a live store?
- Can you show me a before/after comparison from a similar client engagement?
- Do you have experience with my specific platform (Shopify, Magento, custom)?
Validate vendor claims using the testing methodology described earlier. Ask them to run PageSpeed Insights on a page they claim to have improved and share the field data. Lab scores are easy to manipulate; field data from real users is not.
Vertical helps ecommerce stores load faster and convert better
Speed fixes that move Core Web Vitals and conversion rates require the right combination of technical audit depth and commercial judgment. Vertical brings both under one roof: site audits that identify the highest-impact bottlenecks, front-end fixes delivered by developers who understand ecommerce conversion, app and script audits that weigh business value against performance cost, and ongoing monitoring to prevent regressions after every theme update or campaign.
The agency’s integrated approach means the performance work connects directly to paid media, creative, and CRO — so a faster page is also a better-converting one, not just a cleaner Lighthouse report.
If your store’s LCP is above 2.5s or your INP is failing on product pages, the fastest next step is a performance audit. Request an audit from Vertical and get a prioritized fix list with effort estimates you can act on immediately or hand to your development team.
Sources
- Ecommerce site speed and performance guidance - Shopify Enterprise
- PageSpeed Insights
- Shopify speed optimization - DebugBear
- Ecommerce Site Speed & Conversion Rate: Key Statistics
- How to speed up a website | Cloudflare Learning
- Ecommerce Site Speed Optimization: Best Practices for 2026 - EcomHint
Recommended

Other posts


























































Stay ahead with better decisions.
Get business insights today.
