5 ways to calculate cart abandonment and address it
A 76% cart abandonment rate can look alarming, but the calculation is straightforward: subtract completed purchases from carts created, divide by carts created, then multiply by 100. How to fix a high shopping cart abandonment rate starts with understanding what that figure includes, and where shopp...

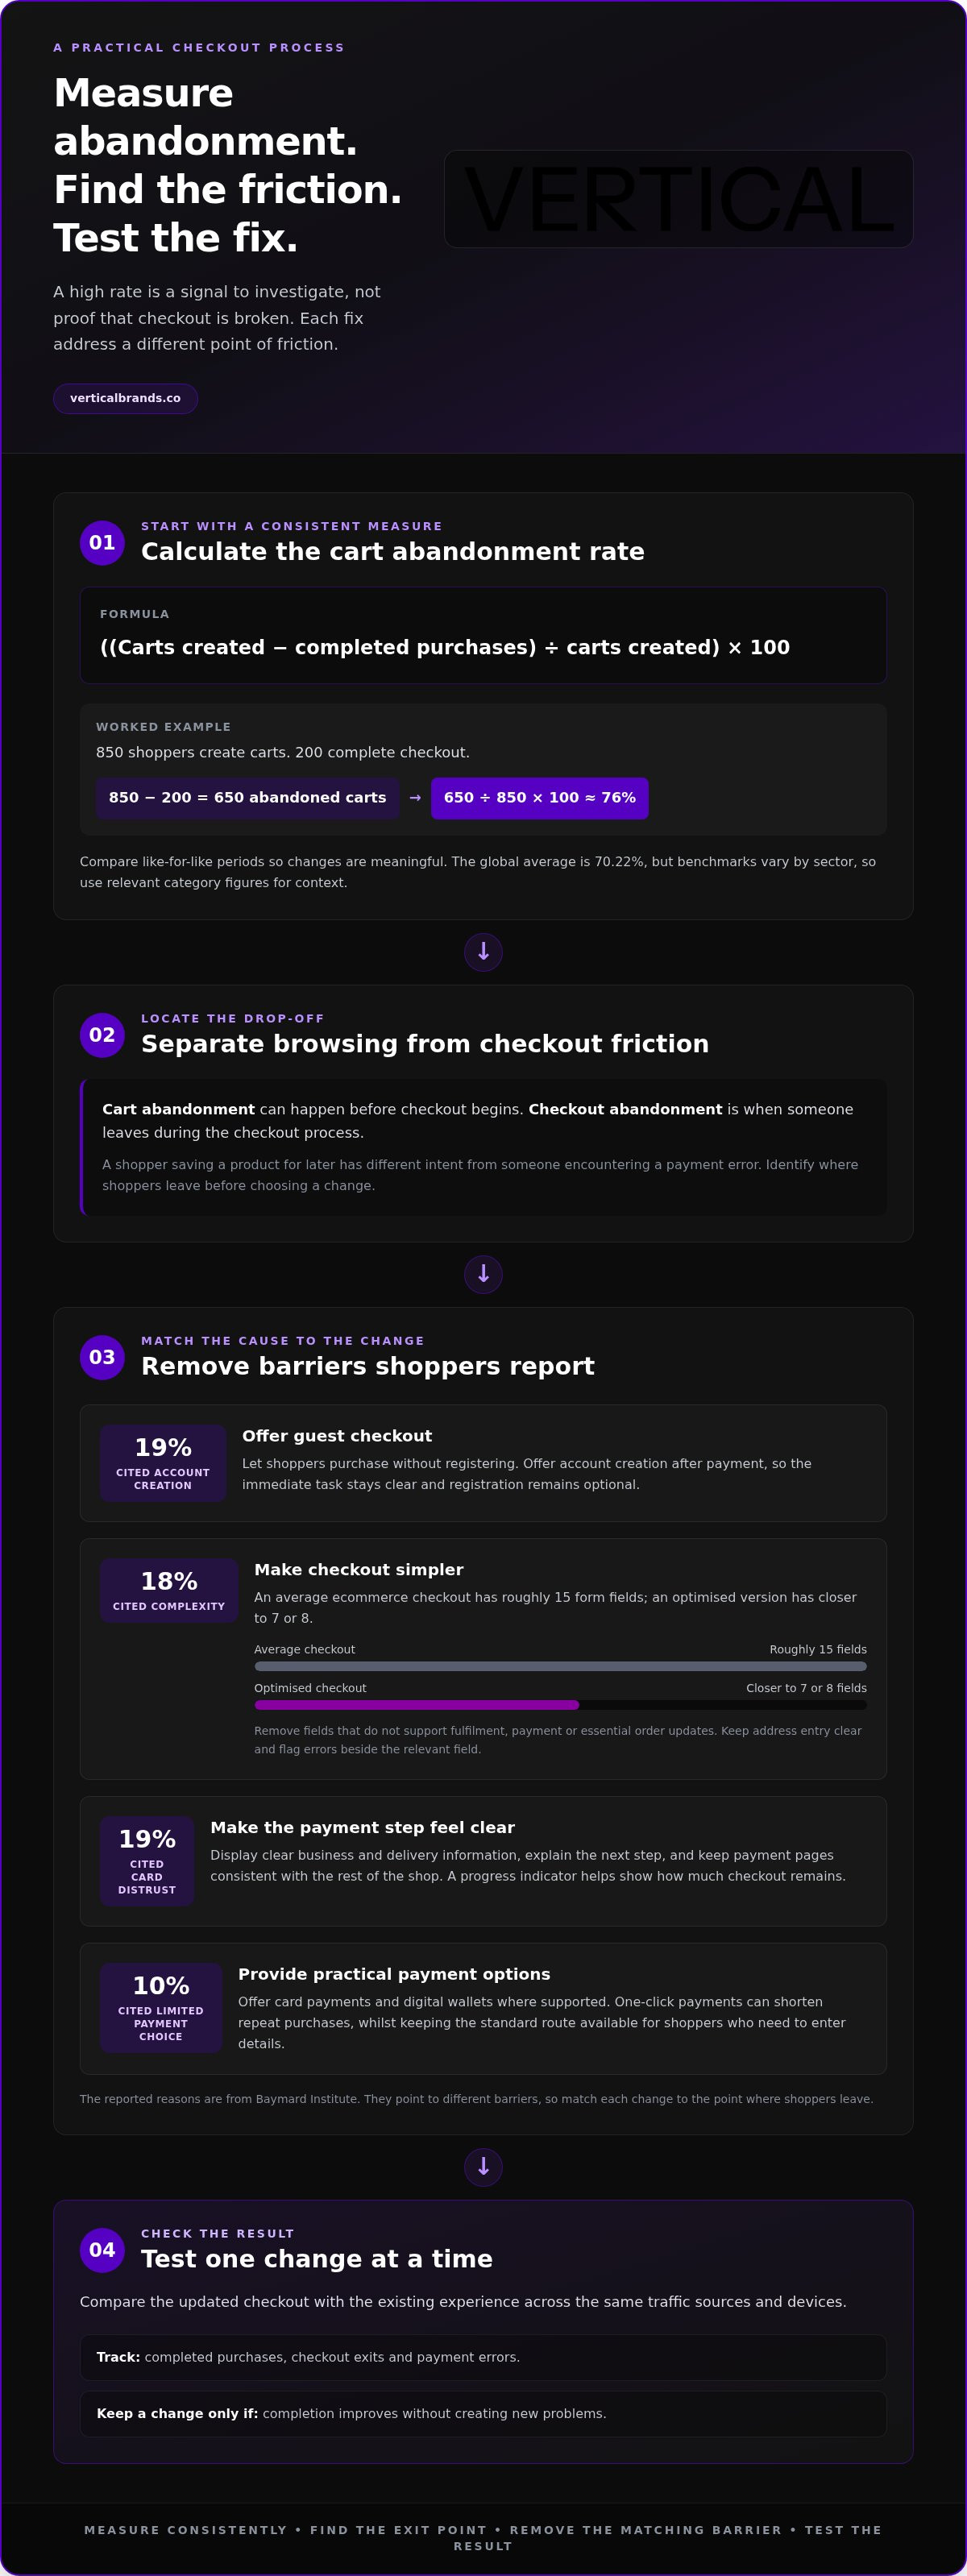
A 76% cart abandonment rate can look alarming, but the calculation is straightforward: subtract completed purchases from carts created, divide by carts created, then multiply by 100. How to fix a high shopping cart abandonment rate starts with understanding what that figure includes, and where shoppers drop out. For example, 850 shoppers adding items to their carts and 200 completing checkout produces an abandonment rate of roughly 76%.
A high rate doesn’t automatically mean your checkout is broken. Some shoppers are browsing, comparing options or waiting to buy, so the average needs context. This article explains how to calculate the rate, compare it with benchmarks and identify abandonment you can act on.
You’ll also find five practical ways to reduce friction, from clarifying delivery costs to improving abandoned-cart emails. The figures are useful only when you connect them to shopper behaviour and address causes your store can influence.
Key Takeaways
• Use a consistent calculation and compare like-for-like periods so changes in cart abandonment are meaningful.
• Benchmarks vary by sector. The global average is 70.22%, so compare your rate with relevant category figures.
• Guest checkout, clear delivery costs and a simpler checkout can remove barriers that makes shoppers abandon.
• Build abandoned-cart emails around useful reminders, shopper objections and relevant incentives, with timing that supports each message.
• Segment recovery emails using customer behaviour and first-party data to make messages more relevant.
1. What is cart abandonment rate?
Cart abandonment rate measures the share of shopping carts that don’t become completed purchases. Cart abandonment can happen before checkout begins, while checkout abandonment describes a shopper leaving during the checkout process. The distinction matters: someone saving a product for later has different intent from someone encountering a payment error.
Guest checkout addresses one avoidable barrier. Baymard Institute reports that 19% of shoppers cited required account creation as a reason for abandoning their cart. Let shoppers complete a purchase without registering, then offer account creation after payment. That keeps the immediate task clear and leaves registration optional.
To see practical ways to reduce friction in an online shop, watch this video:
Checkout complexity creates another point of failure. Baymard Institute found that 18% of shoppers cited a checkout that was too long or complicated. An average ecommerce checkout has roughly 15 form fields, while an optimised version has closer to 7 or 8. Remove fields that don’t support fulfilment, payment or essential order updates. Keep address entry clear, and flag errors beside the relevant field.
Trust matters at the point of payment. Baymard Institute reports that 19% of shoppers cited not trusting a site with their card information. Display clear business and delivery information, explain the next step, and keep payment pages consistent with the rest of the shop. A progress indicator also helps shoppers understand how much of checkout remains.
UK ecommerce sites should offer a practical choice of payment methods, including card payments and digital wallets where supported. Baymard Institute found that 10% of shoppers cited not having enough payment methods as a reason for cart abandonment. One-click payments can shorten repeat purchases, but keep the standard route available for shoppers who need to enter details.
Test checkout changes against the existing experience before making them permanent. Change one element at a time, then compare completed purchases, checkout exits and payment errors across the same traffic sources and devices. Keep a change only if completion improves without creating new problems.
A clear diagnosis is the first step in learning how to fix a high shopping cart abandonment rate. Guest checkout, fewer fields, visible progress and a trustworthy payment flow address different causes, so match each change to the point where shoppers leave.
2. Email personalisation, urgency, timing and optimisation
An abandoned-cart email gives shoppers a route back to the products they considered. Cart recovery emails have an average open rate of 41% and average click-through rate of 9.5%. Companies can typically recover between 5% and 11% of otherwise-lost sales with one or more messages. Treat those figures as a reason to test, not a guaranteed result for every ecommerce shop.
Build a three-email sequence around the shopper’s likely objections. Send the first reminder one hour after abandonment, with product details and a direct route back to the basket. After 24 hours, address a practical concern, such as delivery information or returns. At 72 hours, consider an incentive or a genuine low-stock notice. The three-message sequence are most useful when every email adds something new.
First reminder
Show the selected product and make completing the purchase simple.
Objection handler
Clarify shipping costs, delivery details or product information that may affect conversion.
Final prompt
Use a relevant offer or truthful urgency, never a false countdown or invented stock warning.
Personalisation should make a message more useful, not simply insert a first name. Use the product left in the basket, relevant preferences and available first-party data to tailor content. A cart with a coat may call for sizing or delivery details; a repeat purchase may need a concise reminder. Keep the subject line, product image and landing page aligned.
Exit-intent prompts can invite shoppers to provide an email address before leaving, while push notifications can bring opted-in visitors back. Social retargeting can reinforce reminders across channels. SMS offers another direct route, but use it only when shoppers have agreed to receive that type of message. Avoid sending the same prompt through email, SMS and social at once.
For UK GDPR and PECR, treat abandoned-cart email and SMS as marketing communications: use contact details only where you have an appropriate basis, identify the sender and make opting out straightforward. Apply the same permission discipline across both channels, and keep records of consent and preferences.
Emails can recover between 5% and 11% of otherwise-lost sales, while the recommended sequence spaces messages at one hour, 24 hours and 72 hours. No equivalent recovery rate is available here for SMS, so assess it through your own campaign results. Track delivered messages, clicks, recovered orders, unsubscribes and revenue by channel.
Test one change at a time, such as the first email’s timing or its product content. Compare conversion and opt-outs against the existing sequence before expanding the change. A structured abandoned-cart email programme can help turn those tests into a consistent recovery process.
3. Calculating cart abandonment rate
Use one formula consistently: subtract completed purchases from carts created, divide the result by carts created, then multiply by 100. The result is the percentage of carts that didn’t lead to a purchase. For example, 45 completed purchases from 200 carts means 155 carts were abandoned. Divide 155 by 200, then multiply by 100: the abandonment rate is 77.5%.
A separate example shows why the denominator matters. 300 completed purchases from 1,000 initiated checkouts gives a 70% checkout abandonment rate. That measures shoppers who started checkout, not everyone who created a cart. Label each metric clearly, and don’t compare rates built from different starting events.
To measure abandonment and find checkout drop-off points, track the same funnel events in your ecommerce analytics: cart creation, checkout start, payment submission and completed purchase. Compare how many shoppers reach each step, then identify where the biggest drop occurs. Segment the results by device, traffic source and payment method to find patterns.
Set a consistent reporting period before reviewing results. Compare like with like, such as the same weeks or equivalent trading periods, and keep event definitions unchanged. If one report counts carts and another counts checkout sessions, their percentages describe different behaviour. Metrics provide useful direction only when the underlying events match.
Cart abandonment and checkout abandonment answer different questions. Cart abandonment includes carts that never progress to checkout. Checkout abandonment focuses on people who begin checkout but don’t complete payment. Use the first measure to assess the broader shopping journey, and the second to examine friction inside checkout.
Connect the rate to business outcomes without treating every abandoned cart as recoverable revenue. A shopper may be browsing, comparing products or planning to return later. Separate observed behaviour from assumptions about lost sales. Review completed orders and revenue alongside funnel metrics, then prioritise the drop-off stage with the clearest evidence of friction.
Before drawing conclusions, check that your reporting handles repeat visits consistently. A shopper might create a cart on mobile and purchase later on a computer. If your analytics records those actions separately, cart and purchase counts may not represent one continuous journey. Review how your platform attributes sessions and orders before acting on a sudden change in the rate.
Use the calculation as a diagnostic, not a verdict. For instance, a rising cart abandonment rate alongside stable checkout completion may point to a problem before checkout begins. A falling payment-stage completion rate directs attention further down the funnel. These comparisons help teams choose which step to investigate next.
4. Cart abandonment benchmarks and addressable abandonment
A rate near 70% is common in ecommerce, but it isn’t a universal target. The global average cart abandonment rate is 70.22%, based on an aggregate of 50 independent studies. For a UK retailer, this provides context, not a pass-or-fail standard. Product type, purchase frequency, delivery expectations and payment options all shape shopper behaviour.
Industry benchmarks show why comparisons need care. Home and furniture records a 79.10% abandonment rate, while food and beverage sits at 38.16%. Fashion, accessories and apparel have a 78.74% rolling 12-month average in Dynamic Yield data. Multi-brand retail stands at 67.33%, and luxury and jewellery reaches 77.15%.
Home and furniture
79.10%.
Fashion, accessories and apparel
78.74% rolling 12-month data.
Luxury and jewellery
77.15%.
Multi-brand retail
67.33%.
Food and beverage
38.16%.
These figures aren’t directly interchangeable. A furniture purchase may involve more consideration than a routine food order, while fashion shoppers may compare sizes or styles. Compare your store with the closest available category, using the same calculation method and period. A UK site at 72% could be performing differently from another store at 72%, depending on its category and funnel definitions.
There isn’t one fixed “good” abandonment rate for every UK ecommerce site. Use the 70.22% global average as a reference, then compare with a relevant industry benchmark and your own trend. A sustained change in your store’s rate can be more useful than a single comparison with the global figure.
Not every abandoned cart represents a failed sale. Baymard Institute survey data attributes 43% of cart abandonment to shoppers browsing without purchase intent. That behaviour is different from a customer blocked by a declined card or unavailable payment option. Baymard Institute attributes 18% of actionable cart abandonment to declined cards and missing payment methods.
The addressable abandonment rate is estimated at 25% to 35% of all cart additions. Treat that as a working estimate, not a promise of recoverable orders. Separate low-intent browsing from friction you can address, such as a payment obstacle or confusing delivery information. The reasons behind these figures varies by store, so focus on the causes commerce operations can influence.
For example, if your rate is above 70%, first check whether it reflects your category’s expected buying behaviour. Then review checkout completion, payment failures and customer feedback together. A benchmark identifies a possible gap. Your own funnel data points to the next action.
5. Average shopping cart abandonment rate
The average gives ecommerce teams a reference point, not a diagnosis. A global figure blends different products, shoppers and purchase journeys, so it can hide what is happening in an individual store. The 70.22% global average discussed above is useful for context, but your category and funnel data explain whether friction is actually driving lost orders.
Intent accounts for part of the headline rate. About 50% to 60% of shoppers who add items to their carts are browsing rather than intending to buy during that session. A cart can signal interest, comparison or a saved product, not a definite purchase. That means even a smooth checkout won’t convert every cart into an order.
Separate likely browsing from preventable friction. Baymard Institute reports that 39% of shoppers cited extra costs, such as shipping, tax or fees, as a reason for abandonment. Its survey also found that 21% cited delivery that was too slow. Those causes point to different actions: show the full cost earlier, or make delivery information easier to find.
Compare rates using consistent definitions and periods. If your store’s overall average rises, review the data by device, product category, traffic source and checkout stage. For example, a stable desktop rate alongside a rising mobile rate calls for a different investigation than a rise across every channel. Check whether the change comes from more carts, fewer completed orders or both.
Consider conversion alongside abandonment. A higher cart rate can reflect more low-intent visitors, while a lower rate may follow changes in traffic or product mix. Review completed purchases and revenue alongside cart volume, then consider whether your store can address the underlying cause. Don’t treat the average as a target every category must match.
For a practical review, compare the current period with an equivalent previous period. Then check the biggest drop-off stage and read customer feedback for recurring causes. If shoppers mention unclear sizing, product imagery or missing details, improve the information shown before checkout. If delivery costs dominate, make those costs visible earlier. The right response depends on the evidence, not the headline average.
Use the average to set context, then focus on the addressable causes behind your own rate. A clear product page can help shoppers make informed decisions before adding items. Explore UGC content for product pages to see how customer-created material can give shoppers another view of products. The causes behind cart abandonment often varies by audience, so base your next test on what your store’s data shows.
Vertical Brands: Klaviyo Email Marketing
Vertical Brands helps ecommerce teams turn cart activity into structured email recovery through Klaviyo Email Marketing and Email Marketing & CRM Management. This support is useful when abandoned-cart messages need clearer segmentation, more relevant content or a consistent testing approach. Campaigns can remind shoppers what they considered and address practical objections, while reporting helps teams assess clicks and completed purchases.
Email recovery won’t resolve every cause. If shoppers leave because of unclear delivery costs or checkout friction, those parts of the shopping journey need attention too. Aligning email activity with the wider customer experience gives teams a clearer view of where to act. The right approach depends on the behaviour your data shows, and the messages should reflect that. Contact Vertical Brands to discuss your email marketing needs, or visit verticalbrands.co.
Turn cart data into your next growth decision
Turn your findings into a focused test. Choose one friction point, make a specific change, then track whether shopper behaviour shifts. That discipline helps you learn how to fix a high shopping cart abandonment rate without changing several parts of the buying journey at once.
Keep a record of what you changed, which customers it affected and what happened afterwards. Over time, that record can help your team distinguish temporary fluctuations from recurring problems. It also gives future decisions a stronger basis than assumptions about why shoppers leave.
Cart recovery works best as part of a connected growth strategy. Email activity, paid social and the on-site experience can each support a different stage of the customer journey. The causes of abandoned carts often differ between audiences, so build your next test around evidence from your store.
Discuss your ecommerce growth strategy with Vertical Brands, and take the next step with a clearer plan.
Frequently Asked Questions
What is cart abandonment rate?
Cart abandonment rate is the share of shopping carts that don’t result in completed orders. It helps retailers assess how often shoppers leave without buying, but the figure depends on how a store records carts and purchases. For example, a cart saved for a later visit may not represent a lost sale. Use consistent tracking rules to make comparisons meaningful.
Why do customers abandon their shopping carts?
Customers leave carts for practical, personal or technical reasons. A shopper may be comparing products, checking a size guide or waiting to decide. Another may discover a delivery charge, find their preferred payment method unavailable or encounter an error. Look for patterns in customer feedback and site analytics, then distinguish browsing behaviour from problems the store can address.
What are the main causes of cart abandonment in online shopping?
Common causes include unexpected charges, complicated checkout, slow delivery, limited payment choice and concerns about a retailer’s credibility. Product uncertainty can contribute too: a customer may hesitate if a clothing page lacks fit guidance or a furniture listing omits key dimensions. Review the journey from product page to order confirmation, and connect each reported problem to the relevant page or step.
How do unexpected delivery costs and slow shipping affect cart abandonment?
Unexpected delivery costs can make the final order feel more expensive than the price a shopper considered earlier. Slow or unclear delivery information can also weaken the reason to buy now. Show delivery charges, available options and estimated arrival details before the final payment step. For example, a customer comparing two retailers can assess the full cost and timing without reaching checkout first.
How can UK retailers reduce checkout friction and simplify checkout?
To fix a high shopping cart abandonment rate, identify where shoppers hesitate, then remove unnecessary work. Review checkout on mobile and desktop, check for confusing error messages, and make required fields clear. A customer entering a UK postcode should see address details handled plainly, while order totals and delivery choices remain visible. Test one change at a time and monitor completed orders.
How does offering guest checkout reduce cart abandonment?
Guest checkout lets a customer place an order without first creating a permanent account. That matters for shoppers who want to complete a one-off purchase quickly or don’t want another password to manage. Keep account creation optional, and offer it after the order is placed. For instance, invite customers to save their details on the confirmation page rather than making registration a condition of payment.
How do trust signals, security badges and clear returns policies affect checkout conversion?
Clear, credible information can reduce uncertainty at the point of purchase. Display accurate contact and delivery details, explain how returns work, and use security badges only when they genuinely apply. Keep policies easy to find beside relevant decisions, rather than hiding them in a footer. Baymard Institute identifies trust in card-data handling and unsatisfactory returns policies among reported abandonment reasons. Trust signals work best when they match the actual experience.

Other posts





























































Stay ahead with better decisions.
Get business insights today.
