Incrementality Testing: How to Prove What Your Ads Really Add

Incrementality testing answers one question: how many of your sales would not have happened without a given piece of marketing? You split your audience or your regions into a group that sees the campaign and a group that does not, then compare the results. The gap between the two is the lift your spend caused. Everything else is credit for sales that were coming anyway.
This guide explains how the tests work, how to calculate lift, which design to choose, where tests go wrong, and how incrementality sits alongside attribution and marketing mix modelling.
TL;DR
- Incrementality testing is a controlled experiment: one group is exposed to your marketing, a comparable group is not, and the difference in outcomes is the causal lift.
- Attribution tells you which touchpoints were present before a sale. Incrementality tells you whether the sale needed them. Most experts treat them as complementary, not rivals.
- Pick the design to fit your data and budget: user or audience holdouts, geo experiments, or model-based methods. Reserve the costliest designs for decisions where being wrong is expensive.
- Most failed tests fail on design: control groups that are too small, markets that do not move together, or tests that end too early.
Table of Contents
- What incrementality testing measures
- Incrementality vs attribution
- The main types of incrementality test
- How to calculate incrementality
- Designing a test you can trust
- Which channels and situations suit a test
- Common mistakes
- Standards are moving towards causal proof
- Our perspective
- Getting help with measurement
- FAQ
- Sources
What incrementality testing measures
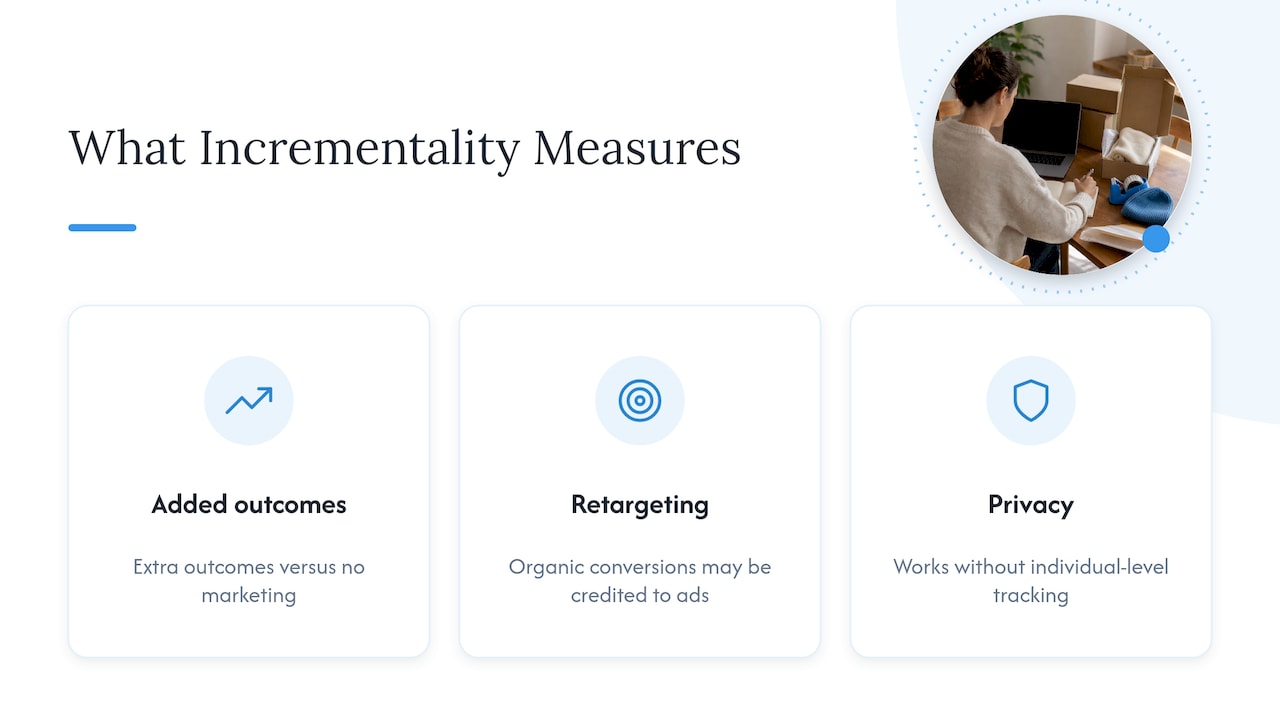
The IAB and IAB Europe define incrementality as the additional business outcomes driven by a campaign or tactic, compared with what would have happened without marketing. The important phrase is “would have happened”. A customer who searches for your brand name and buys is counted by every platform. Whether your brand search ad caused that purchase is a different matter.
That is why a campaign can look excellent in a dashboard and add little to revenue. Retargeting is the classic case. It reaches people who were already close to buying, so it collects conversions that organic behaviour would have delivered anyway. A test tells you how many of those conversions were truly extra.
Incrementality is also described as an answer to a privacy-first environment. It does not need individual-level tracking, so it stays workable as cookies and walled-garden restrictions limit click-based models. If that is a concern for your team, our cookieless marketing playbook covers the wider picture.
Incrementality vs attribution
Attribution distributes credit for a sale across the touchpoints a customer was observed to have. It is fast, granular and available every day, which makes it useful for optimising campaigns, creative and journeys. Its weakness is that it can only see what is trackable, and it cannot tell whether a tracked touchpoint changed the outcome.
Incrementality works the other way round. It is slower and gives you a handful of rigorous answers rather than a daily feed. In return, it provides the causal evidence you need for budget allocation and for defending spend in front of finance. Search Engine Land makes the same point: choosing one over the other leaves the strategy incomplete.
| Attribution | Incrementality testing | |
|---|---|---|
| Question answered | Which touchpoints were involved? | What would have happened without this? |
| Method | Rules or models applied to tracked data | Controlled experiment or causal model |
| Speed | Daily | Weeks per test |
| Best for | Campaign and creative optimisation | Budget allocation, channel decisions |
| Main risk | Over-credits channels that capture existing demand | Poor design gives false lift or false nothing |
A practical way to use both: let attribution run day to day, then use test results to calibrate it. If a test shows that a channel’s true lift is half what the platform reports, apply that ratio when you read the platform’s numbers. Our guide to marketing attribution models explains why platforms tend to favour their own reporting.
The main types of incrementality test
The IAB guidelines group incrementality methods into four families: experiments, model-based counterfactuals, econometric models and hybrid proxies. In practice, marketers in the UK mostly choose between the following.
Audience or user-level holdouts
You randomly withhold ads from a share of eligible people, for example a slice of a retargeting audience, and compare their purchase rate with the exposed group. This is the cleanest design when the platform supports it, and it works well for paid social and email. It depends on the platform’s own ability to randomise and report, so you rely on its tooling.
Geo experiments
You run the campaign in some regions and hold it back in others. For a UK brand, that might mean grouping postcode areas or ITV regions into matched sets. Geo tests suit channels where you cannot randomise individuals, such as TV, out-of-home, audio and some search activity. Google researchers describe randomised paired geo experiments for measuring incremental return on ad spend (iROAS), the ratio of the causal effect on a response such as sales to the causal effect on ad spend.
Model-based and synthetic control
When you cannot hold anything out, a model builds a counterfactual from comparison markets or historical patterns and estimates what would have happened. It costs less than an experiment but is only as good as the comparison data. Treat the result as an estimate with a range, not a single truth.
Marketing mix modelling as the wider layer
Marketing mix modelling estimates the contribution of every channel from aggregate data over time. Test results make a good input, because they give the model a measured anchor instead of an assumption. We cover this in our practical guide to marketing mix modelling.
How to calculate incrementality
The core arithmetic is simple. Take the conversion rate of the test group and the conversion rate of the control group:
Incrementality % = (test conversion rate − control conversion rate) ÷ test conversion rate
Here is a worked example with invented numbers. Suppose a retargeting audience of 200,000 people is split 90/10. The exposed group of 180,000 produces 3,600 purchases, a 2.0% conversion rate. The held-out group of 20,000 produces 320 purchases, a 1.6% rate.
- Incrementality: (2.0% − 1.6%) ÷ 2.0% = 20%
- Only one in five of the conversions the platform claims in that audience was caused by the ads.
- Incremental purchases: 3,600 − (180,000 × 1.6%) = 720.
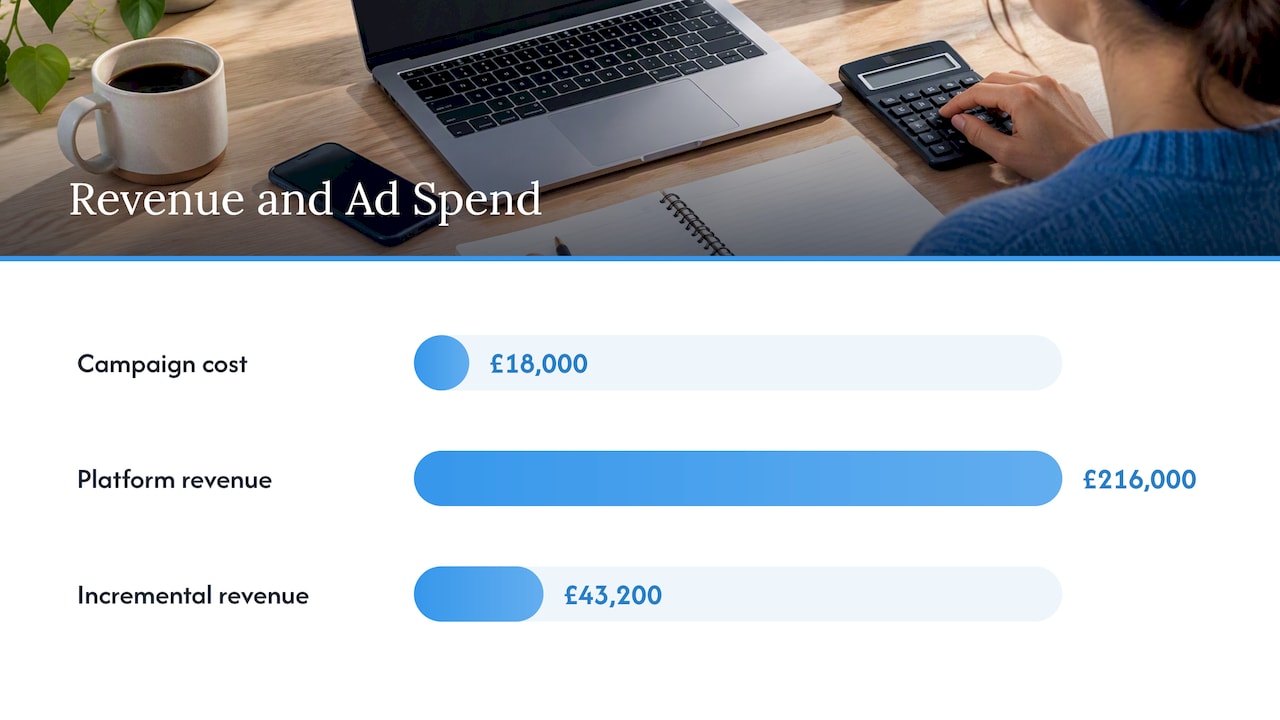
Now compare the cost. If the campaign cost £18,000 and the average order is £60, the platform may report 3,600 × £60 = £216,000 of revenue, a 12x return. The incremental view says 720 extra orders, or £43,200, a 2.4x return. Both numbers are arithmetically right. Only the second one tells you what the spend added.
You can also express the result as iROAS: incremental revenue divided by ad spend. It is the figure to compare across channels when you plan budgets, and it is the one to put in front of a finance director. For how that feeds into planning, see our piece on marketing budget allocation.
Designing a test you can trust
A test that is poorly designed is worse than no test, because it produces a confident wrong answer. These are the points that matter most.
Define the decision first
Write down what you will do with each outcome before you launch. If lift above a threshold means you raise the budget and below it means you cut, the test has a purpose. If every result would lead to “keep going”, do not run it.
Size the groups for the lift you expect
The smaller the effect you want to detect, the more people or regions you need. A group that is too small cannot separate a real 5% lift from random variation, so you end up with an inconclusive result and a spent budget. Understanding how test and control groups behave statistically matters here, particularly when several variables change at once and their interaction effects can mask the one you are measuring. Use a power calculation before launch, not after.
Check that the control actually matches
In a geo test, the control regions must move in step with the test regions before you start. Practitioners use measures such as the Synchronization Error Ratio to check this, as described in the open RealLift geo-experimentation work. Skipping the check risks a “ghost lift”, where the model detects an effect only because the control market diverged for reasons unrelated to your ads, such as weather, a local event or a competitor’s promotion.
Back-test the design
Google’s research describes teams running a pipeline that includes temporal backtesting on historical data to reject unstable designs. A single, one-off test design is fragile. If a design could not have picked out a flat period correctly in the past, do not trust it to read the future.
Run it long enough, and keep everything else steady
Run the test across at least one full buying cycle, and avoid launching big promotions, price changes or new channels in the test window. For a business with a long consideration period, that may mean several weeks of data collection plus time afterwards for delayed conversions.
Make small budgets go further
If you manage several brands, there is a useful option. Research on multibrand geographic experiments looks at running experiments on several brands at once across the same regions. Pooling the information lets each individual experiment be smaller and cheaper while the combined estimates stay robust.
Which channels and situations suit a test
Test where the stakes are high and the doubt is real:
- Retargeting and brand search. The usual suspects for over-credited conversions.
- Paid social prospecting. Meta and TikTok report modelled and view-through conversions. A holdout shows how many were real.
- Performance Max and automated campaigns. Their reporting is opaque, so a test of the incremental value is worth the effort. See our article on Performance Max strategy.
- Upper-funnel channels. Video, audio and out-of-home rarely show up in last-click data, so geo tests suit them.
- Email and CRM. Holding back a share of a flow or campaign shows what the programme really adds beyond repeat buyers who would have returned anyway.
Do not test everything. Each test costs money, because withheld ads or lost sales in the control are real, and time. The IAB guidance on maturity gives a sensible order: start with hybrid proxies where experiments are too costly, move to synthetic control models as your data matures, and keep randomised experiments for the budget decisions where being wrong costs more than the test.
Common mistakes
- Treating one result as permanent. Lift changes with seasonality, creative, competition and audience saturation. Retest your biggest channels periodically.
- Cutting a channel on a single weak test. A flat result can mean the channel does not work, or that the test was underpowered. Check the confidence interval before acting.
- Ignoring spillover. If people in the control group still see your ads through other channels, or buy from a neighbouring test region, lift is understated.
- Optimising to the test metric alone. Lift in first orders can hide poor customer quality. Pair it with margin or lifetime value. Our guide on increasing customer LTV shows how to read this.
- Skipping the plan for the result. A test with no pre-agreed action simply becomes a slide in a deck.
Standards are moving towards causal proof
If you buy media on retail or commerce media networks, this is no longer optional reading. Retail Media Age reports that the IAB Europe Commerce Media Measurement Standards V2, effective since 22 January 2026, set a 30-day lookback window as the default for attribution reporting and expect incrementality measurement to follow approved methodologies. The IAB guidance sets out three principles for credible tests: establish a credible counterfactual, control for bias, and separate signal from noise. Those three principles make a good checklist for any test you run, on any channel.
Our perspective
Most brands we meet do not have a measurement problem. They have a decision problem. The dashboard is full, the numbers disagree, and nobody can say with confidence which pound should move where.
We use incrementality tests to settle those arguments, and we keep them narrow. One question, one channel, one pre-agreed action. If we cannot say what we would do with the answer, we do not run the test.
We also do not treat testing as a replacement for attribution. Platform and analytics data is how teams optimise week to week. Tests are how you check that the numbers feeding that optimisation are honest. Because strategy, creative, performance marketing and web development sit with one team at Vertical, a result turns into a change in the account quickly, with no hand-offs between vendors. That is where most of the value of a test is either captured or lost. Our view on running causal tests is set out in this quarter’s causal test guide.
— Alex
Getting help with measurement
If you want a test designed and read properly, our team can scope it with you as part of a wider digital marketing strategy and performance engagement. We cover paid social, paid search, email and CRM, tracking and attribution, so the same people who run the channels design the experiment and act on the outcome.
FAQ
What is the difference between incrementality and attribution?
Attribution assigns credit for sales to the touchpoints a customer was observed to have. Incrementality tests whether those sales would have happened without the marketing, using a control group. Use attribution for daily optimisation and incrementality for budget decisions.
How do you calculate incrementality?
Subtract the control group’s conversion rate from the test group’s rate, then divide by the test group’s rate. A 2.0% test rate against a 1.6% control rate gives 20% incrementality. Multiply the extra conversions by order value and divide by spend to get incremental return on ad spend.
How long should an incrementality test run?
Long enough to cover at least one full purchase cycle and to gather enough conversions to detect the lift you expect. That usually means several weeks rather than days. Avoid changing prices, promotions or channels during the window.
Can small brands run incrementality tests?
Yes, but pick the cheapest design that answers the question. A platform holdout on a single channel or a model-based method often suits smaller budgets better than a multi-region experiment. If you are unsure which suits your spend, speak to a measurement specialist before you launch.
Sources
- IAB and IAB Europe, Guidelines for Incremental Measurement in Commerce Media
- Search Engine Land, Attribution vs. incrementality: Why you need both
- Google Research, Robust Causal Inference for Incremental Return on Ad Spend with Randomized Paired Geo Experiments
- RealLift: Robust Design and Inference for Geo-Experimentation
- Multibrand geographic experiments
- Retail Media Age, Setting standards for a booming retail and commerce media market
- PlotStudio AI, Interaction effects
Recommended

Other posts

























































Stay ahead with better decisions.
Get business insights today.
