Store Owners: Beat 2.2% Ecommerce Conversion Rate in 30 and 90 Days

Ecommerce conversion rate measures the share of store visits that end in a purchase, and the global blended average sits around 2.2% in 2026. If your store falls below that range, the fastest path to improvement is a checkout friction audit: it surfaces the fixable reasons shoppers leave before they pay.
TL;DR:
- Track sessions based conversion as orders divided by sessions, then check for bot traffic, cross domain gaps, and mismatched reporting windows before trusting results.
- Shopify’s median is about 1.4%, while its top 20% exceed 2.6%; compare by device and category, and treat these figures as directional.
- Segment results by channel, device, landing page, category, and visitor type, then inspect product page to cart, cart to checkout, and checkout completion separately.
- Prioritize guest checkout, early shipping costs, and fewer fields; tests have linked mobile speed gains of 0.1 seconds to 8% to 10% conversion lifts.
- Before testing, choose one primary metric and calculate the required sample size; afterward, segment results by device and channel to catch opposing effects.
Table of Contents
- How do you calculate ecommerce conversion rate?
- What is a good ecommerce conversion rate in 2026?
- Why do shoppers abandon their carts before buying?
- Where should you look to find your conversion leaks?
- Which fixes actually move the needle?
- How should you prioritize and test these changes?
- What should your first 90 days look like?
- What do agencies see that in-house teams often miss?
- Get help turning this plan into results
- FAQ
- Sources
How do you calculate ecommerce conversion rate?
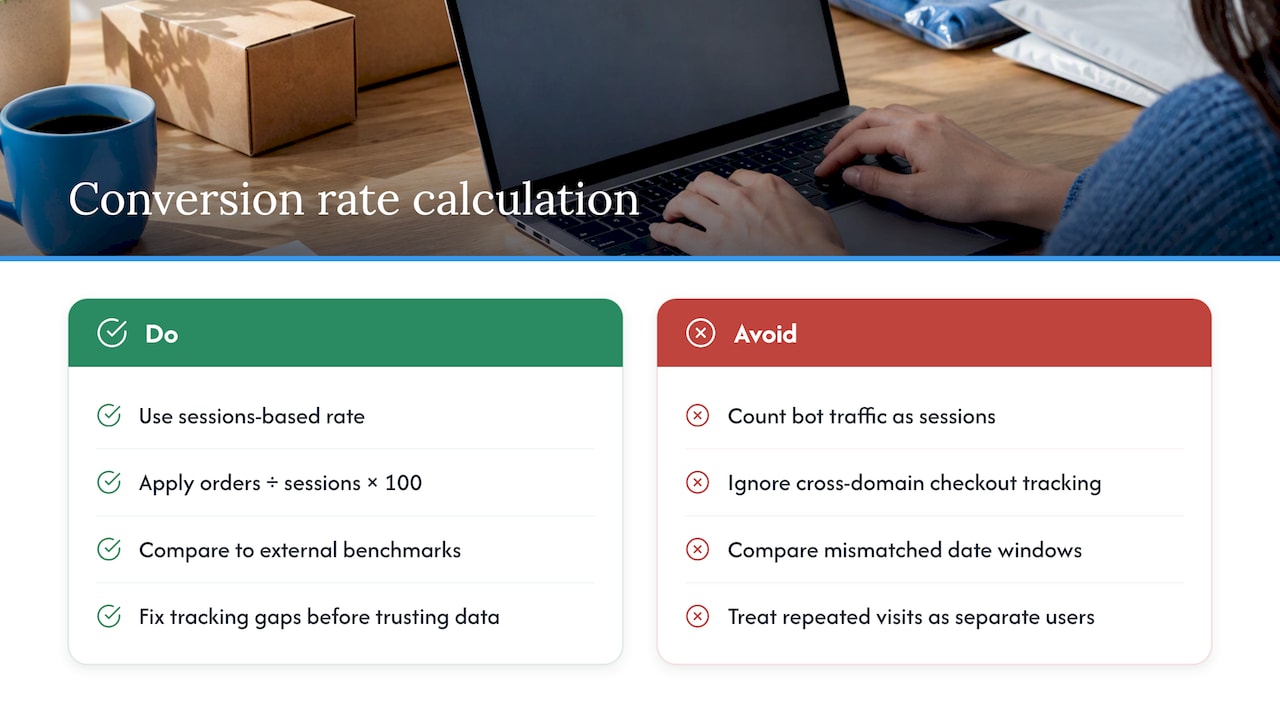
The standard formula is simple: orders divided by sessions, multiplied by 100.
Sessions-based rates and user-based rates tell different stories. Sessions count every visit, so a shopper who returns three times before buying inflates the denominator across visits; user-based rates collapse that behavior into a single visitor. We recommend tracking sessions-based conversion as your primary metric, since most analytics platforms and benchmark sources report it that way, and it is easier to compare externally.
Three issues distort the number: bot traffic inflating sessions without any buying intent, cross-domain tracking gaps when checkout runs on a different subdomain, and mismatched date windows that compare a 30-day period against a 28-day one. Clean these up before trusting your dashboard.
What is a good ecommerce conversion rate in 2026?
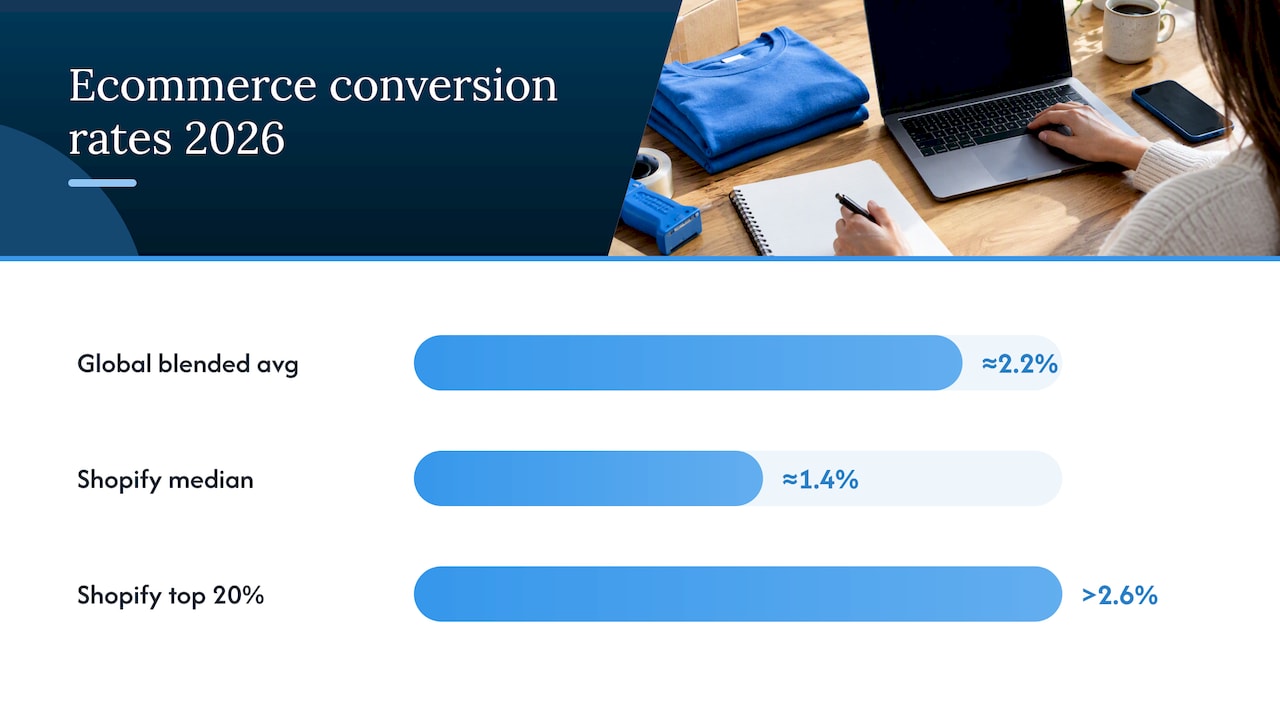
Averages hide more than they reveal. The global blended average is roughly 2.2%, but Littledata’s Shopify benchmark data puts the median Shopify store closer to 1.4%, with the top 20% of stores converting above 2.6%.
Device and category both shift the baseline. Desktop traffic tends to convert higher than mobile, even though mobile often drives more sessions, and industry medians vary widely by what you sell.
These figures come from Littledata’s Shopify benchmarking, so if your platform or catalog differs significantly, treat them as a directional comparator rather than a pass or fail line.
Why do shoppers abandon their carts before buying?
Most cart abandonment traces back to a small set of repeatable problems, and Baymard’s checkout research quantifies them clearly:
- Unexpected costs account for a large share of abandonment, often caused by shipping fees or taxes revealed only at the final step.
- Forced account creation is a significant cause of abandonment, turning a quick purchase into a registration task.
- Overly complex checkout flows also contribute notably, often because of excess form fields; standard checkouts often include more fields than necessary.
- Slow mobile load times, limited payment options, and missing trust signals compound all three.
Not every abandoned cart is fixable through design. Some shoppers use the cart to save items for later or compare prices across sites, and no amount of UX polish changes that behavior. The useful exercise is separating abandonment caused by friction you control from abandonment that reflects normal browsing habits, so engineering effort goes where it pays off.
Where should you look to find your conversion leaks?
Before changing anything, confirm you are measuring the right thing and looking in the right place.
- Calculate conversion as orders divided by sessions in your analytics platform, and treat this as your canonical number for reporting.
- Segment by channel, device, landing page, product category, and new versus returning visitors; blended averages hide which segments are actually underperforming.
- Review your funnel in three stages: product-page-to-cart, cart-to-checkout, and checkout completion, each revealing a different type of friction.
- Pay closest attention to checkout completion drop-off, since that is where unexpected costs and complex flows do the most damage.
- Compare segment performance against your own historical baseline rather than only against industry averages, since internal trends often reveal problems faster.
Which fixes actually move the needle?
Not every tactic deserves equal attention. These are the changes with the strongest evidence behind them, roughly in order of impact.
- Site speed: aim for Core Web Vitals targets of LCP under 2.5 seconds, CLS under 0.1, and INP under 200 milliseconds; mobile speed gains of even 0.1 seconds have produced 8% to 10% conversion lifts in testing.
- Product pages: lead with benefit-driven headlines, surface reviews above the fold, and add a sticky add-to-cart bar on mobile, which tends to produce the largest single-page lift available on a PDP.
- Checkout: offer guest checkout, cut form fields, show shipping costs early instead of at the final step, and add a progress indicator so shoppers know how many steps remain.
- Payments: surface the wallet each device prefers, support the payment methods your market actually uses, and consider buy-now-pay-later where your average order value supports it.
- Trust and fulfillment: state return policies and delivery timelines clearly, and keep security badges visible near the payment fields.
Pro Tip: Fix checkout structure before touching page copy; structural changes like guest checkout and visible shipping costs tend to outperform cosmetic A/B tests.
How should you prioritize and test these changes?
Score every potential fix by expected impact multiplied by ease of implementation, weighted by the traffic volume it touches, as ExperimentFlow recommends. A change that affects your entire checkout funnel outranks one that only touches a single product page, even if the per-visitor lift looks similar on paper.
- Run the fastest, highest-confidence wins first: enabling guest checkout, adding a mobile sticky call-to-action, and introducing a free-shipping progress bar.
- Set a single primary metric per test, usually conversion rate or revenue per visitor, and resist tracking five metrics at once.
- Calculate the sample size you need before launching, so you stop the test only once it has statistical power, not when the result looks convenient.
- Segment results by device and channel after the test ends, since a lift on desktop can mask a loss on mobile.
What should your first 90 days look like?
- Days 1-30: run a full analytics audit, enable guest checkout, add a mobile sticky add-to-cart, and launch a free-shipping progress bar.
- Days 30-90: rebuild weak product pages, reorder payment options by device preference, and launch abandoned-cart email flows alongside onboarding experiments for new visitors.
- Ongoing: report conversion rate, revenue per visitor, and checkout completion rate weekly, with one owner accountable for each metric.
What do agencies see that in-house teams often miss?
In our work across ecommerce accounts, the biggest misprioritization is polishing homepage design while checkout friction quietly bleeds revenue. When we rebuilt the funnel for FACEGYM, purchases rose 50% and bookings rose 41%, proof that structural fixes outperform cosmetic ones. Bring in outside support when your team lacks bandwidth to run disciplined tests; keep it in-house when you already have a steady testing cadence.
— Alex
Get help turning this plan into results
We built our ecommerce practice around exactly this kind of work: closing the gap between a benchmark report and an actual revenue increase. We handle site speed fixes, checkout redesign, conversion rate optimization, paid media, and CRM strategy under one roof, so nothing gets lost between vendors.

- Site speed and Core Web Vitals remediation for ecommerce storefronts.
- Checkout redesign focused on the friction points covered above.
- Paid media and CRM programs that support the funnel once conversion improves.
If you would rather hand the 30/90-day plan to a team that runs this work daily, see our full service list and tell us where your funnel is leaking.
FAQ
What is the formula for calculating conversion rate in retail?
Conversion rate equals the number of orders divided by the number of sessions, multiplied by 100.
Is a 30% conversion rate good?
A 30% conversion rate is far above typical ecommerce benchmarks, where the global blended average sits near 2.2%. A rate that high usually points to a narrow, highly qualified traffic source, such as an email list to existing customers, rather than broad storefront traffic.
Is a 2.5% conversion rate good?
A 2.5% conversion rate sits above the global blended average of about 2.2% and above the median Shopify store at roughly 1.4%. Whether it counts as strong still depends on your industry, since categories like beauty often run higher medians than home goods.
How do you calculate conversion rate in digital marketing?
The core calculation stays the same across digital marketing: conversions divided by total visits or clicks, multiplied by 100. The definition of a conversion can shift by channel, so a purchase, a sign-up, and a lead form submission each need to be tracked and reported separately to avoid blending incompatible numbers.
Sources
- How to Reduce Cart Abandonment (Data-Backed UX Strategies) – Baymard
- Ecommerce Conversion Rate Optimization Strategies | Stripe
- E-commerce Conversion Optimization | ExperimentFlow
- Average Ecommerce and Shopify Conversion Rate (2026) — Littledata
Recommended

Other posts
































































Stay ahead with better decisions.
Get business insights today.
