Marketing Mix Modeling: A Practical Guide for Marketers

Marketing mix modeling (MMM) is a statistical method that measures how media spend, price, promotions, distribution, and outside conditions like seasonality drive sales, without relying on individual-level tracking data. It uses aggregate, historical data rather than cookies or device IDs, which is why it’s regaining ground as part of a broader omnichannel marketing strategy to unify customer experience that adapts to privacy changes.
Marketing leaders typically turn to MMM for:
- Budget allocation across TV, paid social, search, and offline channels
- ROI and elasticity estimation to justify or cut spend by channel
- Scenario forecasting ahead of a launch, price change, or new market entry
- Calibrating other measurement methods, including attribution and lift tests
Statistic Callout: MMM has historically been treated as a once-a-year strategic exercise, but Gartner reports the industry is shifting toward agile, automated scenario planning that supports faster, more frequent decisions.
Key Takeaways
Marketing mix modeling works because it isolates the causal, incremental impact of media, price, promotions, and distribution on sales using aggregate historical data rather than user-level tracking.
| Point | Details |
|---|---|
| MMM answers strategic questions | Use it for cross-channel budget allocation, pricing elasticity, and quarterly forecasting, not daily optimization. |
| Data quality beats data volume | Clean, mapped promotional calendars and pricing history matter more than extra years of sales data. |
| Uncertainty is part of the output | Bayesian credible intervals show a range of plausible ROI, not a single definitive number. |
| Layer methods, don’t pick one | Combine MMM with geo-lift experiments and platform attribution for a complete measurement stack. |
| Vertical Brands builds MMM into strategy | Vertical Brands scopes, builds, and validates MMM as part of integrated strategy and performance work, as demonstrated in FACEGYM’s purchase increase. |
Table of Contents
- What Is Marketing Mix Modeling Used For?
- How Does Marketing Mix Modeling Actually Work?
- What Data Does an MMM Need to Run?
- How Do You Interpret MMM Results?
- How Do You Build and Deploy an MMM?
- Should You Use MMM or Attribution and Testing?
- What Are the Biggest Limitations of MMM?
- How Much Does an MMM Program Cost?
- What Operational Habits Make MMM Actually Work?
- Does Marketing Mix Modeling Actually Move the Needle?
- Why Most Teams Get MMM Half Right
- Getting Expert Support for Your Marketing Mix Modeling Project
- Frequently Asked Questions
- Sources
What Is Marketing Mix Modeling Used For?
Marketing mix modeling and media mix modeling get used interchangeably, and that’s a mistake worth correcting early. Media mix modeling looks narrowly at advertising channels. Marketing mix modeling covers the full commercial picture, pulling in price, distribution, promotions, seasonality, and competitive activity alongside media. It’s also fundamentally different from multi-touch attribution: attribution tracks individual user journeys, while MMM works at an aggregate level, market by market or week by week, without needing to identify a single person’s click path.
That aggregate view is exactly what makes MMM useful for a specific set of decisions. Here’s where it earns its place in the measurement stack:
- Cross-channel budget allocation. Deciding whether the next $500,000 goes to paid social or linear TV.
- Brand versus activation balance. Quantifying how much of this quarter’s sales came from long-term brand investment versus short-term promotions.
- Promotional planning. Sizing the sales lift from a discount event against its margin cost.
- Pricing elasticity. Estimating how a price increase will move volume before you actually raise the price.
- Distribution and regional shifts. Modeling what happens to sales if you pull back shelf space or expand into a new territory.
Picture three real scenarios. A CPG brand builds its Q4 holiday promotion calendar using last year’s model output, shifting spend away from a channel that showed early saturation. A regional retailer, facing a new competitor opening stores nearby, uses MMM to figure out whether reallocating spend toward local search offsets the share loss.
None of this requires cookies, device graphs, or user-level consent flows, which is precisely why interest in MMM has accelerated as signal loss from privacy regulation and browser changes has made single-view attribution far less reliable.
Pro Tip: Don’t pitch MMM internally as “the new attribution.” Pitch it as the tool that answers the budget questions attribution was never built to answer in the first place.
How Does Marketing Mix Modeling Actually Work?
At its core, MMM runs time-series regression on historical data, then applies a set of transformations that convert raw marketing activity into something that behaves like it does in the real world: media spend doesn’t hit sales instantly, and it doesn’t keep paying off forever as you pour more in.
Here’s the working vocabulary you need before you can read a model output intelligently:
- Adstock: the decay of an ad’s effect over time. A TV spot doesn’t stop working the day it airs; it fades over subsequent weeks according to a decay rate.
- Lag: the delay between exposure and the resulting sale, often just a few days for search, longer for brand campaigns.
- Saturation (diminishing returns): the point where additional spend in a channel produces smaller and smaller incremental sales.
- Elasticity: the percentage change in sales for a 1% change in an input, most often used for price.
- Response curve: the plotted relationship between spend and incremental outcome, usually showing a steep rise followed by a flattening tail.
- Carryover: the combined effect of adstock and lag, describing how an activity’s impact stretches across future periods.
- Base versus incremental: base is what you’d sell with zero marketing activity; incremental is the lift attributable to marketing and other modeled drivers.
Model form matters more than most teams realize going in. An additive model assumes each input adds a fixed amount to sales regardless of scale, which is simpler to interpret but often wrong for categories with strong seasonal swings. A multiplicative model assumes effects scale with the size of the base, which tends to fit better when promotions or seasonality cause big swings in volume. PyMC-Marketing’s technical guidance frames the choice of transformation order, whether you apply the response curve before or after adstock, as one of the more consequential specification decisions a modeler makes.
The other major fork is Bayesian versus frequentist estimation. Traditional frequentist regression gives you point estimates and confidence intervals derived from repeated-sampling theory, which works fine with long, clean data histories. Bayesian MMM lets you inject prior knowledge (from past experiments, industry benchmarks, or last year’s model) and produces posterior distributions instead of single numbers. That means every output, a channel’s ROI, an elasticity figure, comes with a credible interval attached, not just a headline figure. Google’s MMM guidance points to this as one of the clearest advantages of Bayesian approaches: it manages sparse data more gracefully and forces everyone in the room to talk in ranges instead of false certainty.
Pro Tip: Ask your analytics team for a response curve chart, spend on the x-axis, incremental sales on the y-axis, for your top three channels. If the curve is already flattening at current spend levels, that channel is closer to its ceiling than the raw ROI number suggests.

What Data Does an MMM Need to Run?
An MMM is only as good as what feeds it, and the checklist is longer than most first-time buyers expect. At minimum, you need:
- Outcome variable: weekly or daily sales, revenue, or units, at the geography or brand level you’re modeling
- Media spend by channel: TV, paid social, paid search, display, out-of-home, radio, and impressions or GRPs where available
- Price: list price, net price, and any discounting activity
- Promotions: timing, mechanic, and depth of every promotional event
- Distribution: store count, shelf placement, or e-commerce availability changes
- External controls: seasonality, holidays, weather, and macroeconomic indicators like unemployment or consumer confidence
- Competitive signals: competitor pricing, promotions, or major launches where trackable
- Experiment results: any geo tests or holdout results that can calibrate the model later
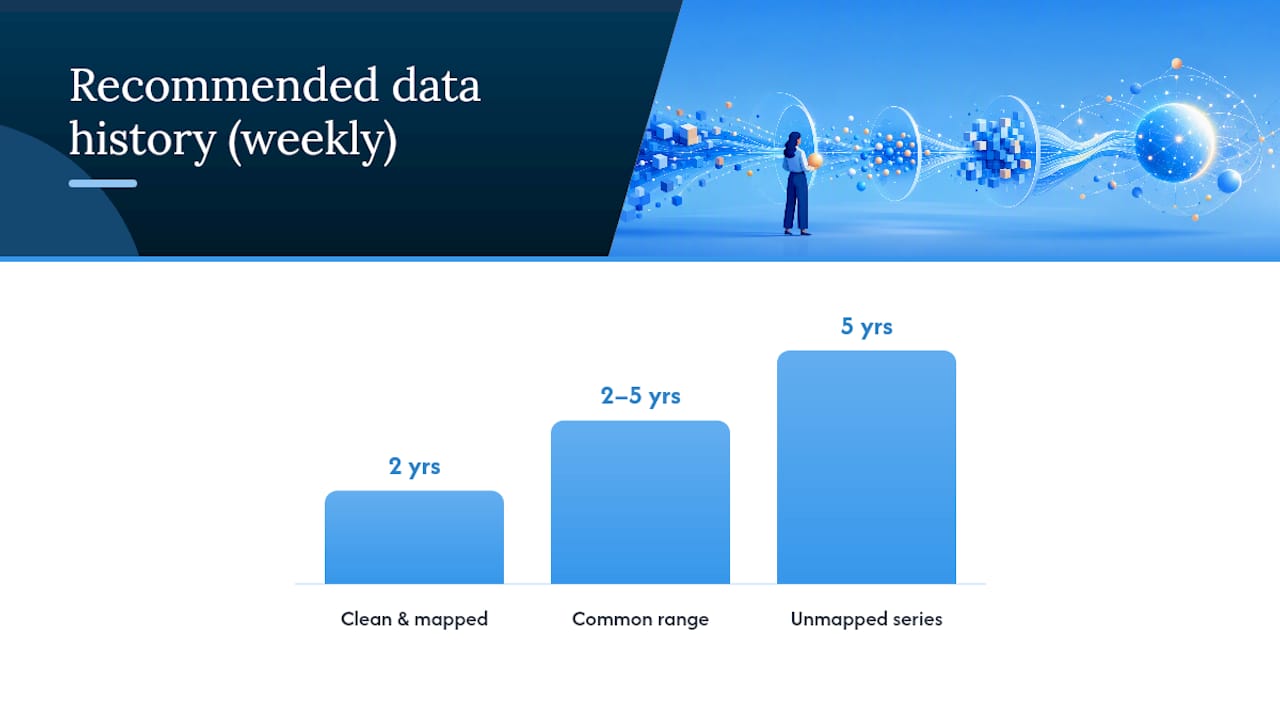
On granularity, weekly data over two to five years of history is the common working range. Shorter histories can work for fast-moving categories with lots of variation, but Ipsos MMA’s analysis is blunt about the real constraint: two years of clean weekly data with a properly mapped promotional calendar beats five years of sales figures with no record of what pricing or promotions did in between.
| Variable Category | Typical Data Source |
|---|---|
| Sales/revenue outcome | Internal POS systems, CRM, e-commerce platform exports |
| Media spend and impressions | Ad platform reporting (search, social, display, TV buying data) |
| Pricing and promotions | Internal pricing systems, trade promotion management tools |
| Distribution | Internal retail/DTC systems, syndicated retail audit data |
| Seasonality and external factors | Holiday calendars, weather data, macroeconomic indicators |
| Competitive activity | Syndicated market data, public pricing/promotion tracking |
Before any of this goes into a model, run it through a basic quality check: are promotional calendars mapped to the exact weeks they ran, not just the month? Is media spend rolled up consistently across platforms so a rebrand or agency switch doesn’t create a false break in the series? Are missing weeks flagged and handled deliberately rather than silently interpolated? Is every input aligned to the same time grain, no mixing daily spend data with weekly sales figures without reconciling the two? Skipping this step is the single most common reason a technically sound model produces outputs nobody trusts.
How Do You Interpret MMM Results?
A finished model produces a specific set of outputs, and misreading any one of them can send a budget in the wrong direction. The core deliverables are:
- Base versus incremental decomposition: how much of total sales would happen with zero marketing activity, versus how much came from measured drivers
- Channel contribution percentages: each channel’s share of total incremental sales
- ROI or ROAS estimates: return per dollar spent, by channel
- Response and saturation curves: the shape of returns as spend increases
- Adstock decay parameters: how long each channel’s effect lingers
- Elasticity coefficients: sensitivity of sales to price or other continuous variables
- Scenario forecasts: projected sales under alternative budget or pricing plans
The number that gets the most attention, headline ROI, is also the easiest to overread. A single ROI figure hides a range of plausible values, and Bayesian approaches surface that range explicitly through credible intervals rather than pretending a point estimate is exact. A channel with an ROI of 3.2 and a credible interval running from 1.8 to 4.9 is telling you something very different than a channel with the same 3.2 estimate and a tight 2.9 to 3.5 range.
Pro Tip: Use the model to rank headroom, not to crown winners. A channel showing lower ROI but a response curve that hasn’t started flattening yet often has more upside than a “top performer” already sitting on the flat part of its curve.
Reading contribution shifts year over year tends to be more reliable than trusting any single period’s absolute numbers, since seasonality and one-off events can distort a single quarter. Ask your analytics team to standardize on three visuals every refresh: a contribution pie chart by channel, a marginal return curve for the top three to five spend lines, and an adstock decay plot showing how long each channel’s effect persists. Together those three charts tell most of the story a budget committee actually needs.
How Do You Build and Deploy an MMM?
Running an MMM project is a sequence, not a single deliverable, and skipping steps is where most in-house attempts go sideways. The stages run in this order:
- Scope the model. Define the business questions, the geography and time window, and which decisions the output needs to support.
- Ingest and clean data. Pull sales, spend, pricing, promotion, and external data into one consistent, time-aligned dataset.
- Engineer features and transformations. Build adstock and saturation curves, encode seasonality, and structure promotional and control variables.
- Estimate the model. Fit the regression, whether frequentist or Bayesian, and review coefficient signs and magnitudes for plausibility.
- Validate and calibrate. Run holdout tests, backtest against known periods, and compare model estimates to any available lift or geo test results.
- Deploy and refresh. Push outputs into a reporting format stakeholders can actually use, and set a cadence for updating the model.
Each stage has its own failure points worth watching for. Data ingestion is where mismatched promotional calendars quietly poison a model before it ever gets estimated. Feature engineering is where the adstock decay rate and saturation curve shape get chosen, often the most sensitive decisions in the entire build, and PyMC-Marketing’s documentation flags getting these wrong as the fastest way to misallocate a media budget based on a technically “working” model.
Validation deserves its own checklist:
- Hold back the most recent 10 to 20% of the time series and test whether the model predicts it accurately
- Backtest against a known historical event, a launch, a price change, a competitor’s entry, and see if the model captures the direction and rough magnitude
- Compare modeled channel effects against any available geo-lift or holdout experiment results
- Run scenario sanity checks: does doubling a channel’s budget in the model produce a plausible, not absurd, sales projection?
Ipsos MMA’s guidance on program maturity points to continuous refresh cycles, in-market test validation, and stakeholder-accessible dashboards as the traits separating programs that actually change budgets from ones that produce a report nobody reads. On refresh cadence, you have three real options: continuous updating as new data lands, monthly refreshes for fast-moving categories, or quarterly refreshes for slower, more seasonal businesses. Automation matters here mostly because manual re-runs tend to slip, and a model that’s a year stale is worse than no model at all.
On timeline and team, a focused single-brand model typically takes eight to twelve weeks from kickoff to first deployed output. An enterprise program spanning multiple brands or markets runs considerably longer, often stretching across multiple quarters as data pipelines get built market by market. Either way, you need four roles at minimum: a data engineer to handle ingestion and pipeline work, an analyst or data scientist to build and validate the model, a commercial subject-matter expert who understands the promotional and pricing history well enough to sanity-check outputs, and a decision-maker with the authority to actually act on what the model says.
Pro Tip: Book your validation partner (whoever runs geo-lift tests or holdout experiments) before the model build starts, not after. Retrofitting a calibration test onto a finished model wastes weeks you don’t have.
Should You Use MMM or Attribution and Testing?
The short answer: MMM handles strategic, cross-channel, privacy-safe budget decisions, incrementality experiments handle high-precision causal validation, and platform attribution handles in-flight, short-term optimization. None of the three replaces the other two, and the strongest measurement programs run all three in a layered stack rather than betting everything on one method.
The decision flow is more practical than it sounds. If the question is “how should next year’s budget split across channels,” run MMM. If the question is “did this specific campaign in this specific market actually cause a lift,” run a geo-lift or holdout test. If the question is “which creative or audience is performing best inside this platform this week,” use the platform’s own attribution data. The methods complement each other directly: geo tests calibrate MMM’s coefficients so the model’s estimates track reality more closely, and attribution data fills the gap between MMM refreshes, giving you a short-term read while you wait for the next quarterly model update.
Use this checklist to pick the right tool for the question in front of you:
- Is the decision strategic and multi-quarter? Lean on MMM.
- Do you need to prove causality for a specific channel or market? Run an incrementality test.
- Do you need daily or weekly optimization signal inside one platform? Use that platform’s attribution.
- Are your MMM coefficients feeling stale or implausible? Schedule a geo-lift test to recalibrate.
Pro Tip: Don’t let a platform’s self-reported attribution numbers and your MMM’s channel contribution numbers coexist unreconciled in the same budget meeting. Decide in advance which number governs which decision, or every review turns into an argument about whose math is right.
What Are the Biggest Limitations of MMM?
MMM is powerful, but it’s not magic, and pretending otherwise is how models lose credibility with the people who need to act on them. The most common limitations:
- Dependence on historical data. A model can’t predict the effect of a channel or tactic it has never seen used before.
- Data quality bottlenecks. Missing or misaligned promotional and pricing history undermines accuracy far more than a short time window does.
- Collinearity. When channels move together (a TV flight always paired with a paid social push), the model struggles to separate their individual effects.
- Coarse granularity. Weekly, market-level data can’t tell you which creative or micro-audience is working inside a channel.
- No real-time optimization. MMM informs quarterly or annual budgets, not daily bid adjustments.
- Organizational friction. The biggest barrier to acting on MMM output is often internal readiness, not model accuracy.
Watch for a few red flags that signal a model isn’t reliable yet: a data history shorter than a year, a promotional calendar that’s incomplete or approximate, or residual spikes in the model’s fit that nobody can explain against a known event. Any of those should delay a budget decision, not just get footnoted in the deck.
Mitigation is mostly about discipline rather than fancier math. Clean up data hygiene before touching model architecture. Run calibration experiments to anchor coefficients that collinearity has made shaky. Use hierarchical or Bayesian structures when data is sparse across markets, since they borrow strength across groups rather than forcing each market to fit independently. And build change management into the project plan from day one, because a technically accurate model that nobody in the organization is positioned to act on delivers zero value.
Pro Tip: If your model shows a channel with an implausibly high ROI relative to everything else, check for collinearity before you celebrate. The model is often crediting one channel for gains actually driven by something running alongside it.
How Much Does an MMM Program Cost?
Budget expectations should track project scope, not a flat rate card. A single-brand, single-market model typically runs on the eight-to-twelve-week timeline mentioned earlier. Multi-brand, multi-market enterprise programs extend well beyond that, mostly because data pipelines have to be rebuilt market by market and because international rollouts add currency, seasonality, and regulatory variation that single-market builds never encounter.
The cost drivers worth budgeting honestly for:
- Data engineering time, often the single most underestimated line item, since cleaning years of spend and promotional history rarely goes as fast as planned
- Software or licensing, whether that’s a commercial platform or the engineering time to run an open-source stack
- Analyst and data science hours for model build, validation, and iteration
- Experiment costs for any geo-lift or holdout tests used to calibrate the model
- Agency or consulting fees if you’re bringing in outside expertise rather than building entirely in-house
Resourcing needs a defined team, not just a budget line. That means a data engineer, an analytics lead who owns the model build, a commercial subject-matter expert who can sanity-check outputs against what actually happened in market, a brand or product owner who will use the results, and an executive sponsor with the authority to reallocate budget based on what the model says. Skipping the sponsor role is the quiet killer of most MMM programs: without someone empowered to act, the model becomes a very expensive report.
What Operational Habits Make MMM Actually Work?
A handful of repeatable habits separate MMM programs that drive real budget decisions from ones that stall after the first readout.
- Maintain a living promotional calendar. Update it in real time rather than reconstructing it at model-build time from memory.
- Standardize channel taxonomy. Use the same channel names and groupings across ad platforms, finance systems, and the model itself.
- Treat uncertainty as information, not noise. Present credible intervals alongside point estimates in every readout.
- Integrate experiments on a schedule. Don’t wait for the model to feel “off” before running a calibration test.
- Automate refreshes where possible. A model that requires a six-week manual rebuild every quarter will quietly get skipped when things get busy.
On governance, the programs that actually change spend tend to run a recurring cross-functional measurement forum, media, finance, and brand in the same room reviewing the same numbers, paired with a simple model-to-decision playbook that spells out which outputs trigger which budget conversations.
Pro Tip: Prioritize clean spend roll-ups before you touch model architecture. A perfectly specified Bayesian model fed inconsistent spend data will still produce garbage. And where possible, anchor your model’s causal estimates with real experiment data rather than priors alone, since even a small geo-lift test gives the model something concrete to calibrate against.
Does Marketing Mix Modeling Actually Move the Needle?
FACEGYM’s work with Vertical Brands offers a useful illustration of what measurement-led decision-making looks like in practice, even outside a pure MMM context. The brand needed clearer signal on which channels and tactics were actually driving purchases and bookings, rather than relying on platform-reported numbers that often overstate their own impact.
Working across strategy, paid media, and measurement, the engagement focused on connecting spend decisions to actual outcome data rather than surface-level platform metrics. The approach relied on grounding channel decisions in outcome data rather than self-reported platform numbers, a principle that sits at the center of any credible MMM build.
Statistic Callout: The result was a notable increase in purchases and bookings for FACEGYM. In an MMM context, that kind of shift usually shows up as a channel’s contribution and ROI estimate moving meaningfully between model refreshes, evidence that reallocated spend is actually producing incremental outcomes, not just repackaging sales that would have happened anyway.
Why Most Teams Get MMM Half Right
The gap between what MMM promises and what teams actually get from it usually comes down to one thing: treating the model as a math problem instead of a decision-making tool. A perfectly specified regression with clean adstock curves and tight credible intervals is worthless if nobody with budget authority is in the room when the results come out.
We’ve found the more useful frame is to work backward from the decision. Before a single line of data gets cleaned, we ask what budget call this model needs to inform, and who needs to sign off on it, because that shapes everything from granularity to refresh cadence. Measurement built in isolation from strategy and creative tends to produce technically sound answers to the wrong question. Measurement built alongside the people who set budgets and brief campaigns tends to actually get used.
If you’re weighing whether to build MMM capability in-house or bring in outside support, that’s a conversation worth having early, not after a model’s already stalled.
Getting Expert Support for Your Marketing Mix Modeling Project
Vertical Brands runs marketing mix modeling as an integrated part of a strategy and performance engagement, not as a standalone data science exercise handed off with a slide deck. That means the model gets scoped alongside the people who’ll actually act on it: paid media leads, creative teams, and the executives who control the budget it’s meant to inform.

The engagement covers scoping, data ingestion and cleansing, model build and validation, and the operational work of turning outputs into a refresh cadence your team can sustain quarter over quarter. Vertical Brands works across project, retainer, and advisory structures depending on whether you need a one-time strategic model or an ongoing measurement partner integrated with paid media and creative execution.
If your current measurement setup can’t tell you with any confidence which channel deserves the next dollar, talk to Vertical Brands about scoping a marketing mix modeling engagement built around the specific budget decisions your team is facing this year.
Frequently Asked Questions
Is marketing mix modeling the same as media mix modeling? No. Media mix modeling looks only at advertising channels, while marketing mix modeling covers the full commercial picture, including price, distribution, promotions, and external factors like seasonality.
How much historical data do you need to build an MMM? Two to five years of weekly data is the common range, but clean, well-mapped promotional and pricing history matters more than the raw number of years covered.
Can MMM replace attribution or A/B testing? No. MMM handles strategic, cross-channel budget decisions, while attribution and incrementality tests handle short-term optimization and causal validation, and the strongest programs run all three together.
What’s the difference between Bayesian and frequentist MMM? Bayesian models incorporate prior knowledge and produce credible intervals showing a range of plausible outcomes, while frequentist models produce single point estimates with confidence intervals based on the data alone.
How often should an MMM be refreshed? Options range from continuous updating to monthly or quarterly refreshes, depending on how fast your category moves and how much your channel mix changes.
Sources
- What Is Marketing Mix Modeling? | Ipsos MMA
- Marketing mix modeling | Gartner
- FAQ on media mix modeling: How to build a modern measurement strategy — eMarketer
- Marketing Mix Modeling Guidebook (Think with Google)
- Introduction to Media Mix Modeling — PyMC-Marketing
Recommended

Other posts





























































Stay ahead with better decisions.
Get business insights today.
