90 Minute Marketing Funnel Mapping Template for Busy Growth Teams

Marketing funnel mapping is the process of visualizing every stage a prospect moves through, from first contact to purchase and beyond, alongside the assets, metrics, and owners tied to each step. Done well, it produces a working document, not a slide that gets filed away. This guide gets you there fast: a map, a KPI plan, and a template you can start filling in today.
TL;DR:
- Mapping the biggest drop-off stages first ensures more effective use of resources than polishing less critical parts.
- Assigning a specific owner to each funnel stage is essential for accountability and continuous improvement efforts.
- Tracking micro-conversions within each stage helps diagnose where prospects stall, enabling targeted optimizations.
- Using simple, visual formats like timelines or swimlane diagrams improves stakeholder understanding and cross-team collaboration.
- Tool selection should match your team’s maturity, starting with whiteboards and evolving to analytics and automation only as the funnel is validated.
Table of Contents
- What Marketing Funnel Mapping Covers and Why It Matters
- Which Funnel Stage Model Should You Use?
- How Do You Actually Map a Marketing Funnel Step by Step?
- Which Template or Visual Format Fits Your Funnel?
- What Tools Actually Support Funnel Mapping?
- What Metrics and KPIs Should You Track at Each Stage?
- Who Should Own Each Stage of the Funnel?
- What Are the Most Common Funnel Mapping Mistakes?
- How a Funnel Map Drove Measurable Growth for FACEGYM
- What Should You Actually Prioritize First?
- How Vertical Brands Turns Funnel Maps Into Measurable Growth
- Where to Learn More About Funnel and Journey Mapping
- Sources
What Marketing Funnel Mapping Covers and Why It Matters
A funnel map is a diagnostic tool before it’s anything else. It shows you where prospects enter, where they stall, and where they either convert or vanish. Once that picture exists, three things get easier: finding leaks, aligning marketing and sales around the same handoff points, and prioritizing which experiments are worth running next.
Most teams discover their funnel map when something breaks. Traffic is up but bookings are flat. Sales complains leads are unqualified. A launch underperforms and nobody can say exactly where. These moments are the right trigger for a mapping exercise, not a quarterly calendar reminder. Run one whenever you add a new acquisition channel, restructure your sales process, or notice a metric moving without an obvious cause.
It’s worth separating funnel maps from the broader discipline of customer journey mapping early, because the two get conflated constantly. A funnel map tracks linear conversion steps and the metrics attached to them: click through, add to cart, checkout. A journey map captures something wider and messier, including emotions, non-linear paths, and touchpoints that never show up in an analytics dashboard. Journey mapping done through a platform like Salesforce tends to surface relationship and experience gaps, while a funnel map answers a narrower question: where exactly are we losing conversions, and how much is each leak costing us?
Use funnel mapping when the goal is optimization. Use journey mapping when the goal is understanding experience. Most growth teams need both eventually, but funnel mapping is the faster, cheaper place to start because it points directly at revenue.
The practical benefits stack up quickly once a map exists:
- You can see exactly which stage transition has the worst conversion rate, rather than guessing.
- Marketing and sales stop arguing about “lead quality” in the abstract and start pointing at a shared stage definition.
- You can rank experiments by expected impact instead of running whatever idea got pitched loudest in the last meeting.
- New hires and stakeholders understand the customer path in minutes instead of weeks of tribal knowledge.
- Budget conversations shift from “spend more on ads” to “fix this specific stage before spending more.”
Journey and funnel maps both work best when they support a clear business goal and rest on real evidence, not assumptions pulled from a brainstorming session. That single rule, evidence over guesswork, separates maps that get used from maps that get archived.
Which Funnel Stage Model Should You Use?
There’s no universal funnel model, and picking the wrong one wastes weeks of mapping effort on a structure that doesn’t match how your customers actually buy. The right choice depends on purchase cycle length, how many people are involved in the decision, and whether the relationship is one-time or recurring.
The classic three-stage TOFU/MOFU/BOFU model (top, middle, bottom of funnel) works for straightforward B2C purchases with a short consideration window. It’s simple enough for a five-person team to align on in one meeting, but too coarse for anything with a sales team or a multi-week buying process.
AIDA (Awareness, Interest, Desire, Action) is the oldest model in marketing and still useful for content and campaign planning, especially for single-purchase consumer products. Its weakness is that it stops at the sale. If retention and referral matter to your business, AIDA leaves half the picture blank.
The five to six stage model (Awareness, Interest, Consideration, Intent, Purchase, Loyalty/Advocacy) is the workhorse for most SMB marketing teams. It’s granular enough to catch mid-funnel drop-off that a three-stage model would miss, without requiring the mapping overhead of an enterprise sales funnel.
The flywheel model replaces the funnel’s straight line with a loop, treating retained and delighted customers as an acquisition input rather than an endpoint. Subscription businesses and anything with strong referral or word-of-mouth dynamics should map this way, because a linear funnel undercounts the value of an existing customer bringing in a new one.
Matching the model to the business is mostly about two variables:
- Purchase cycle length: a same-day impulse buy needs fewer stages than a six-month enterprise sale.
- Buying committee size: B2B deals with multiple stakeholders (a champion, a budget holder, a technical evaluator) need stages that reflect each internal handoff, not just the vendor-facing steps.
- Revenue model: subscription and repeat-purchase businesses need a stage for renewal or expansion; one-time purchase businesses can stop at conversion.
- Sales involvement: if a human sales rep touches the deal, add stages for qualification and proposal that a self-serve funnel doesn’t need.
Whichever model you pick, map micro-conversions inside each stage, not just the big milestone. “Consideration” isn’t one event. It might include a pricing page visit, a demo request, a comparison guide download, and a case study view, each a signal worth its own tracking event. Micro-conversions are what let you diagnose where inside a stage someone stalls, rather than just knowing they stalled somewhere in a three-week window.
How Do You Actually Map a Marketing Funnel Step by Step?
Mapping a funnel isn’t a design exercise. It’s an audit followed by a build, and the order matters more than most guides admit. Skip a step and the map looks polished but tells you nothing useful when a stakeholder asks why bookings dropped.
-
Clarify the trigger and objective. Name the specific business question driving this exercise. “Understand our funnel” is too vague to act on. “Why does trial signup not convert to paid at the rate it did in Q1” is a trigger you can map against. Write the objective at the top of the document before drawing a single box.
-
Inventory your assets and data. List every page, email, ad, and sales touchpoint currently live in the funnel, and note what data exists for each. Most teams find gaps here immediately: an ad set with no landing page tracking, a checkout page nobody has looked at analytics for since launch. A prioritized funnel should start from your ideal customer profile and real customer conversations, not from the assets you happen to already have, so pull in a handful of actual sales calls or support tickets before you assume you know where people get stuck.
-
Spot where people stall. Using whatever analytics you already have, even imperfect data, mark the stage-to-stage transitions with the steepest drop-off. This is usually obvious once you look: a 40% cart abandonment rate, a demo request page with a 2% conversion rate, a trial that never gets activated. Flag these as priority zones rather than trying to fix everything simultaneously.
-
Define exit criteria and CTAs for every stage. A stage isn’t real until you can say precisely what moves someone out of it. “Consideration” needs an exit criterion like “requested a demo” or “downloaded pricing,” not a vague sense that someone is “engaged.” Attach the specific call to action that should trigger that exit, and check that the current CTA copy actually asks for it. Stage-appropriate messaging is often the fastest fix once you can see where a CTA doesn’t match the stage it sits in.
-
Build the visual map with assumptions and owners labeled. Draw the stages left to right, note the assumption behind each transition (why you believe this stage leads to the next), and assign a named owner to each box. An unowned stage is the single most common reason maps stall out after the workshop ends.
-
Wire up events, set a baseline, and run small experiments. Instrument tracking for every exit criterion you defined in step four, pull a baseline conversion rate for each transition, then test one change at a time against that baseline. Many practical funnel guides recommend mapping one clear path first and instrumenting it before adding automation complexity, and that sequencing holds up: a simple, measured funnel beats an elaborate, unmeasured one every time.
Pro Tip: Run steps one through three in a single ninety-minute workshop with marketing, sales, and one customer-facing support person in the room. The stall points people disagree on are almost always where the real leak is hiding.
Each step builds on the one before it, which is why skipping the audit to jump straight to a pretty diagram backfires. A map built on assumptions instead of actual drop-off data will look convincing and point your team at the wrong fix.
Which Template or Visual Format Fits Your Funnel?
The right visual format depends on what question you’re trying to answer, not on which template looks best in a deck. Four formats cover almost every use case.
A timeline works when the story is mostly sequential and you want stakeholders to grasp the customer’s path at a glance. It’s the fastest format to build and the easiest for a non-marketing executive to read in one sitting.
A swimlane diagram earns its complexity when multiple teams touch the same funnel. Each horizontal lane represents a function, marketing, sales, product, support, and the map shows exactly where the customer crosses from one team’s responsibility to another’s. This is the format B2B teams with a sales handoff should default to, because the handoff points are exactly where deals get dropped.
A single-page funnel compresses everything, stages, metrics, and owners, onto one document meant for a leadership review or a quick weekly check. It sacrifices detail for speed, which is the right trade when the audience needs a status update, not a working session artifact.
A service blueprint goes deepest, mapping front-stage customer actions against back-stage operational processes (fulfillment, support systems, internal tooling) that the customer never sees but that shape their experience anyway. Service blueprints and similar structured formats give teams the fields they need to make a map more than a pretty picture, particularly when operational friction, not marketing message, is the suspected culprit.
Whatever format you choose, a usable template needs six fields filled in, no exceptions:
- Persona: who is moving through this specific path.
- Stages: the named steps from your chosen model.
- Touchpoints: every page, email, ad, or conversation at each stage.
- Metrics: the conversion rate or KPI tied to each transition.
- Owner: the named person responsible for that stage’s performance.
- Evidence: the data or research backing the assumption at each step.
Teams with limited bandwidth should resist the urge to build a custom template from scratch. Pre-built options in a tool like Miro’s funnel template library get a team from blank canvas to first draft in under an hour, and the constraint of a fixed template format often forces better discipline than a free-form whiteboard would.
What Tools Actually Support Funnel Mapping?
Tool choice should follow your team’s maturity, not the other way around. A five-person startup doesn’t need the same stack as a fifty-person growth team, and buying enterprise tooling too early usually just adds a subscription nobody has time to configure properly.
Visual canvases and whiteboards are the entry point for almost every team, and rightly so. A shared digital whiteboard lets marketing, sales, and product sketch the funnel together in real time, which matters more than the software itself in the early stages. The value here is collaborative visibility, not analytical horsepower.
Funnel simulators sit a level up, letting teams model traffic volumes, conversion assumptions, and financial outputs before committing budget to a campaign or a redesign. Tools built for deterministic simulation, such as FunnelMapper.io, let a team test “what if we improved this stage’s conversion by five points” scenarios on paper before touching a single ad account. That’s a meaningfully different use case from a whiteboard: simulation answers “what should we expect,” while a canvas answers “what does this look like.”
Analytics and event tracking is where the map meets reality. Whatever visual tool you use upstream, you need a system capturing the actual events tied to your stage exit criteria, page views, form submissions, cart adds, so the map’s assumptions can be checked against real numbers rather than intuition. For ecommerce specifically, a dedicated funnel tracking playbook walks through the event structure most consumer brands need to get right before trusting their conversion data.
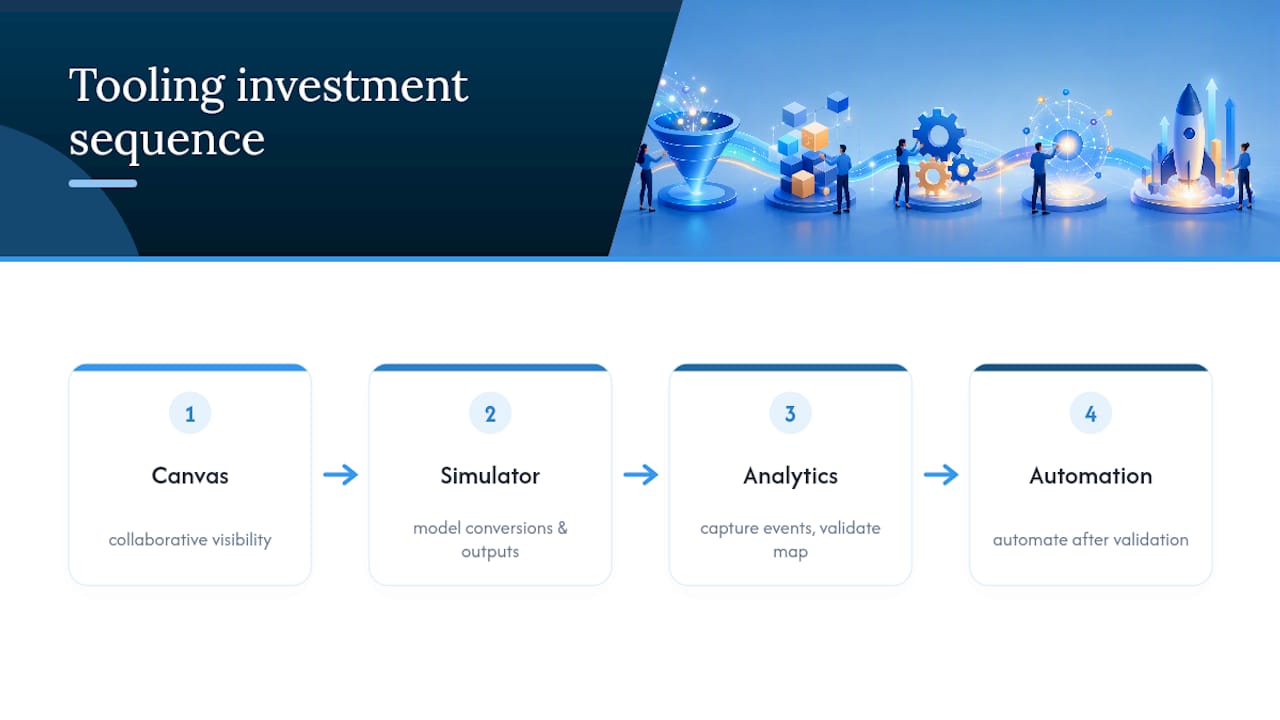
Automation and orchestration platforms come last, and only once the funnel has been validated with real data. Automating a broken path just breaks it faster and at higher volume. Sequence your tooling investment in that order: canvas, simulator, analytics, automation, and resist the pull to buy the flashiest tool first.
What Metrics and KPIs Should You Track at Each Stage?
Every stage transition needs one primary conversion metric, and every funnel needs a handful of overall health metrics that sit above the individual stages. Skip either and you’ll either drown in dashboards or fly blind on the numbers that actually matter.
Stage-to-stage conversion rate is the diagnostic workhorse. Track the percentage moving from awareness to interest, interest to consideration, and so on, because the specific transition with the steepest drop tells you exactly where to focus, rather than a blended top-to-bottom conversion number that hides the real problem.
A funnel’s weakest transition usually costs more than its entire top-of-funnel budget combined. A landing page converting at 2% instead of a realistic 5% doesn’t just lose visitors, it silently inflates your effective cost per acquisition across every channel feeding that page, no matter how efficient your ad spend looks upstream.
Four numbers round out a minimal KPI set:
- Customer acquisition cost (CAC): total spend divided by new customers acquired, tracked by channel so you can see which acquisition source is actually efficient.
- Lifetime value (LTV): total expected revenue per customer, which determines how much CAC you can afford to sustain.
- Average order value (AOV): useful for spotting whether a conversion problem is about volume or about basket size.
- Time-in-stage / sales cycle length: how long prospects sit in each stage before moving, which flags stalled deals before they show up as lost revenue.
For instrumentation, resist building a comprehensive dashboard on day one. Start with three things: event tracking on every stage exit criterion you defined during mapping, a weekly stage-to-stage conversion report, and a single dashboard view combining CAC and LTV by channel. A well-structured KPI dashboard built around those three elements will surface most of the leaks worth fixing long before a more elaborate reporting build is justified.
Who Should Own Each Stage of the Funnel?
A funnel map without named owners is a diagram, not a program. This is the single most common reason mapping workshops produce a nice-looking document that nobody ever opens again.
Assign one person, not a team, as the accountable owner for every stage transition. “Marketing owns awareness to interest” is too diffuse; “the paid social lead owns awareness to interest, reviewed monthly” is specific enough to actually work. Clarifying who owns each transition is the difference between a map that gets executed and one that sits in a shared drive, because ownership is what turns an observation into an action item with a deadline.
Handoff rules matter as much as ownership itself:
- Define exactly what data or context passes from one owner to the next at each stage boundary.
- Set a clear escalation path: if a stage’s conversion rate drops below a defined threshold, name who gets notified and within what timeframe.
- Put stage reviews on a fixed cadence, monthly for most SMB funnels, weekly during an active experiment, rather than leaving reviews to happen “when someone remembers.”
- Treat major funnel restructures as decision gates requiring sign off from both marketing and sales leadership, not a unilateral change by whoever built the map.
Pro Tip: Put the owner’s name directly on the visual map itself, not in a separate spreadsheet. A name attached to a box in a shared document gets checked on far more often than a name buried three tabs deep.
Review cadence should match how fast the funnel actually changes. A stable, mature funnel might only need a quarterly check-in, while a funnel under active experimentation needs eyes on it weekly until the test concludes.
What Are the Most Common Funnel Mapping Mistakes?
Most failed funnel maps fail for one of three reasons, and each has a fast fix.
- Over-engineering the first draft. Teams try to map every possible path and micro-segment before validating the main one. Fix: map a single high-value path first, ship it, then expand.
- No named ownership. A map with “marketing” or “the team” as an owner gets no follow-through. Fix: one name per stage, visible on the document itself.
- Missing or unreliable data. Assumptions get treated as facts because nobody checked analytics before drawing boxes. Fix: pull at least a rough baseline for every stage before finalizing the map.
Prioritize fixes using a simple impact times effort lens: a low-effort fix on your steepest drop-off stage beats a high-effort redesign of a stage that’s already converting well. Starting with one clear funnel and iterating produces faster wins than building comprehensive automation upfront, and that same logic applies to fixing mistakes, not just building the initial map.
Reserve a full redesign for stages where the underlying model itself is wrong, not just underperforming. If a stage’s conversion rate is merely below target, run an experiment. If the entire stage no longer reflects how customers actually buy, redesign it.
How a Funnel Map Drove Measurable Growth for FACEGYM
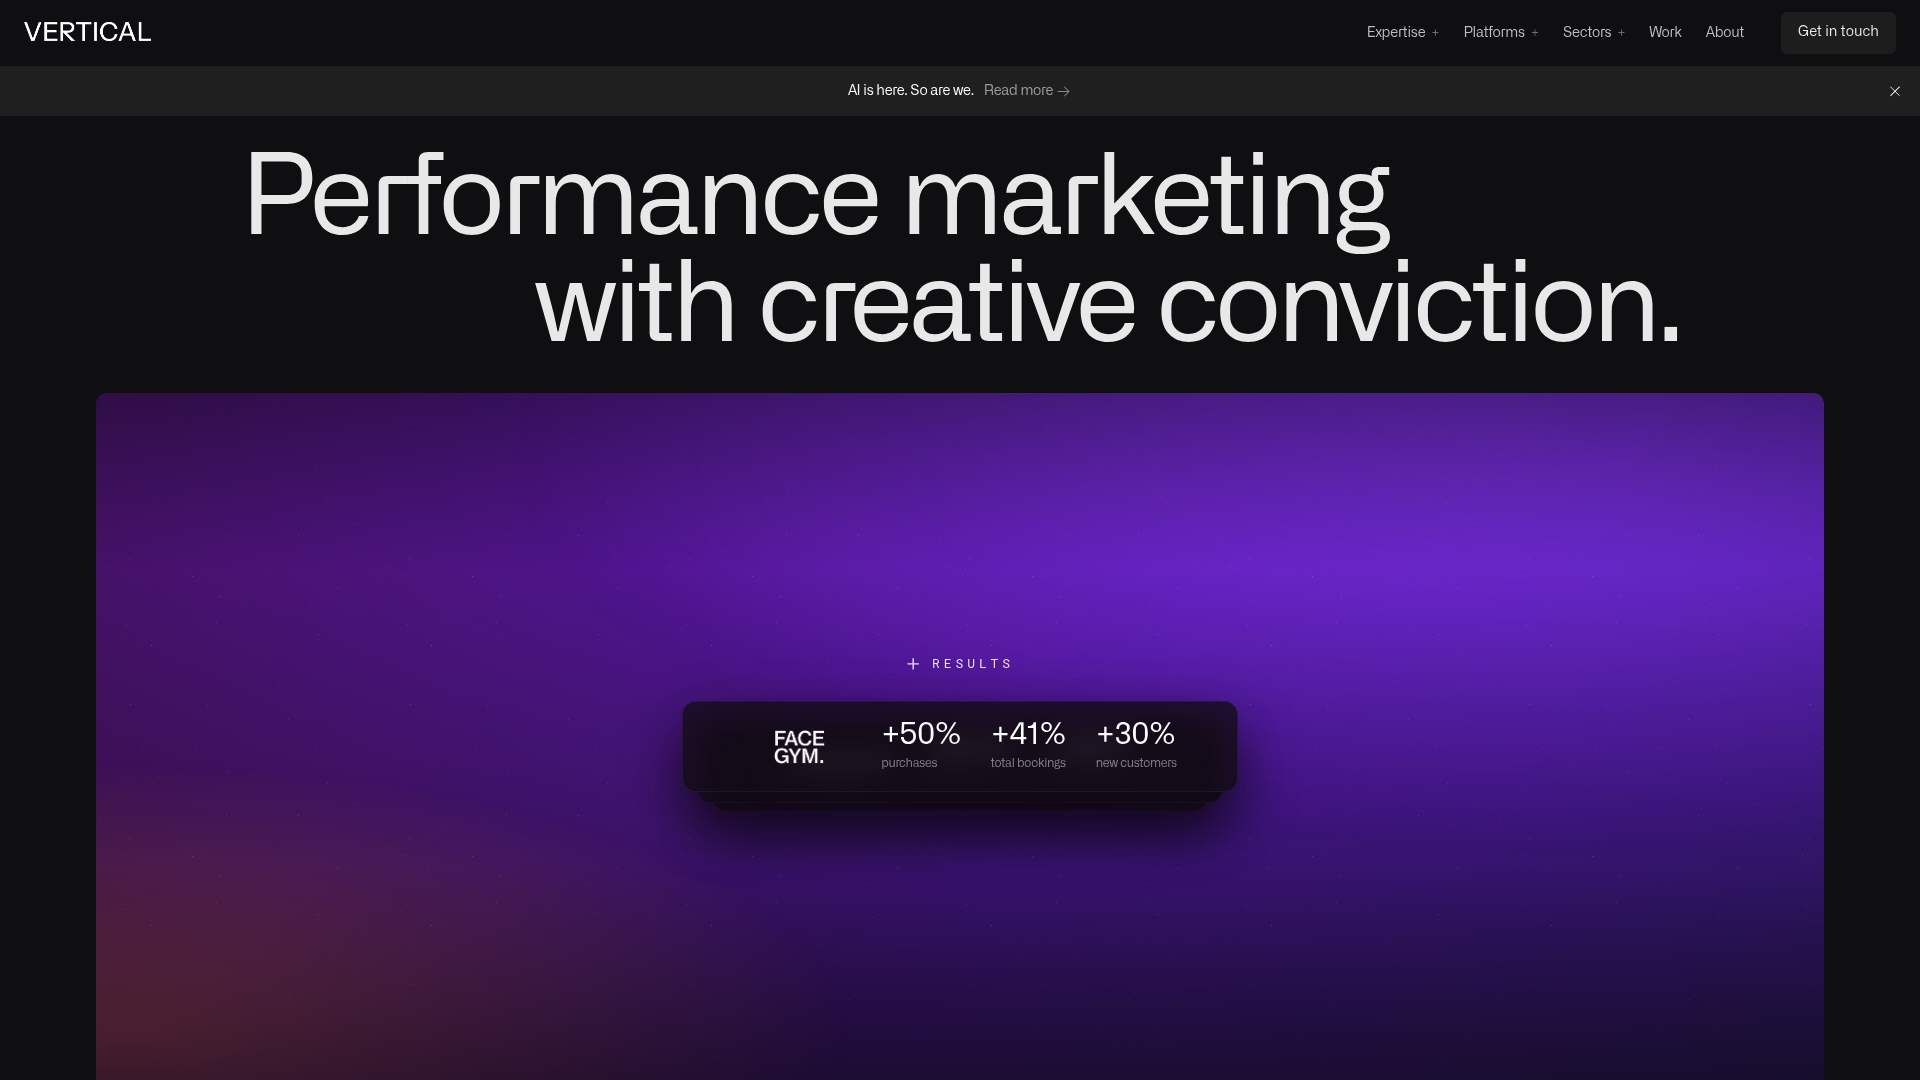
Funnel mapping earns its place in a marketing plan when it changes a real number, and the FACEGYM engagement is a clear example of that. Working with Vertical Brands, the FACEGYM team mapped its funnel to find exactly where clarity was missing between ad click and completed booking.
The mapping work centered on three fixes: tightening CTA clarity at each stage so visitors always knew the next action, wiring up measurement that had previously been inconsistent across channels, and assigning clear ownership for the handoff between marketing-driven traffic and the booking flow itself.
Readers looking to replicate this should prioritize the same order of operations: fix message clarity at each stage exit before adding budget, get measurement consistent before running experiments, and name an owner for the handoff points where marketing traffic becomes a sales or booking outcome.
What Should You Actually Prioritize First?
Fix the biggest leak before you fix anything else. It sounds obvious written down, but most teams instead polish the stage that’s easiest to change or most visible to leadership, regardless of whether it’s actually costing the business money. Pull your stage-to-stage conversion data, find the steepest drop, and start there even if it’s the least glamorous stage to work on.
Keep the map simple longer than feels comfortable. The instinct to add nuance, more stages, more segments, more conditional paths, kicks in almost immediately once a team sees the first draft, and it’s almost always premature. A map that fits on one page and gets reviewed monthly beats a detailed one that’s too complex to update and quietly goes stale.
The most underrated benefit of a mapping session isn’t the document at all. It’s that marketing, sales, and support end up agreeing on shared stage definitions in the same room, which resolves more cross-team friction than the map itself ever will.
— Alex
How Vertical Brands Turns Funnel Maps Into Measurable Growth
A funnel map only pays off once someone actually builds, instruments, and owns what it points to, and that’s the gap most in-house teams run into after the workshop ends. Vertical Brands closes it by handling the full scope in one place: strategic mapping, analytics wiring, creative production, and campaign execution, so the map doesn’t sit in a shared drive waiting for bandwidth that never shows up.
A typical engagement runs as a 30 to 90 day pilot: weeks one and two map the funnel and instrument tracking against the exit criteria you actually need, weeks three through eight run targeted creative and messaging fixes against the leak with the worst conversion rate, and the final stretch validates results against baseline and hands off a documented, owned map your team can maintain going forward. If a done-for-you version of this process fits where your team is right now, request a briefing with Vertical Brands and get a scoped plan for your funnel.
Where to Learn More About Funnel and Journey Mapping
Several resources go deeper on specific pieces of this process:
- NN/g’s guide to customer journey mapping covers evidence-based mapping practice in more depth.
- Atlassian’s team playbook offers frameworks for ownership and cross-team handoffs beyond marketing.
- Harvard Business School Online’s primer on customer journey maps breaks down template fields and formats.
- Dashly’s sales funnel strategy guide expands on stage-by-stage handoff and qualification criteria.
- Miro’s funnel template library is a practical starting point for teams building their first visual map.
Sources
- Customer journey maps: When and how to create them - NN/g
- Customer journey map: How to create one (HBS Online blog)
Recommended

Other posts


































































Stay ahead with better decisions.
Get business insights today.
