One Month, One Page Growth Marketing Framework for Marketing Leaders

A growth marketing framework is a repeatable system for finding and scaling what actually grows a business, built on one North Star metric, 2 to 3 channels where you have a real structural edge, and a steady cadence of disciplined experiments. Skip the frameworks that just diagnose problems and go straight to the operating model: pick your metric, narrow your channels, run tests with clear decision rules, and reinvest what wins. Done right, that system compounds into a flywheel instead of a funnel that resets every quarter.
TL;DR:
- Focusing on two to three channels with genuine structural advantages and running disciplined experiments significantly increases the likelihood of sustainable growth.
- Relying on a single, clear North Star metric and setting explicit decision rules before testing helps optimize resource allocation and reduces wasted efforts.
- Building a simple, one-page growth framework with assigned owners and a consistent cadence ensures ongoing execution and prevents stagnation.
- Prioritizing channel-specific tests based on impact, confidence, and ease prevents scattered efforts and promotes measurable, incremental progress.
- Lean digital tools and proper attribution practices are crucial for accurate measurement, enabling teams to make informed scaling decisions.
Table of Contents
- Key Takeaways Before You Build Anything
- What Growth Marketing Actually Is (and Isn’t)
- The Frameworks Worth Knowing (and When to Use Each)
- How to Build Your One-Page Growth Framework
- Running Experiments That Actually Produce Decisions
- Planning Cadence and Governance That Prevents Stalling
- Metrics, Dashboards, and Attribution Without the Bloat
- When to Scale a Winner and Build the Flywheel
- Proof This Framework Works: The FACEGYM Result
- Templates and Resources to Put This Into Practice
- What This Framework Gets Right (and Where Most Advice Goes Wrong)
- Sources
Key Takeaways Before You Build Anything
You don’t need six frameworks stitched together to run growth marketing well. You need one operating model, applied with discipline.
- Pick a single North Star metric everyone in the company can name without checking a dashboard.
- Choose 2 to 3 channels where you have a structural advantage, not just a hunch.
- Run several experiments periodically aimed squarely at your current bottleneck.
- Write a decision rule before you launch a test, not after you see the results.
- Score your backlog with ICE (Impact, Confidence, Ease) so resources go to the tests most likely to move the needle.
- Review performance on a fixed cadence, weekly for tactics and monthly for strategy.
- Treat wins as inputs to a flywheel, not one-off victories to celebrate and forget.
Statistic callout: Businesses that lean on more digital tools and continuous testing are 1.6 times more likely to forecast positive future revenue growth, according to Intuit QuickBooks. That gap tends to trace back to exactly the discipline this framework enforces: fewer channels, clearer metrics, faster decisions.
The most common failure isn’t a bad hypothesis. It’s channel promiscuity, chasing five platforms at once with none of them fully resourced, and skipping the decision rule that tells you what to actually do when a test finishes.
What Growth Marketing Actually Is (and Isn’t)
Growth marketing is the discipline of running structured experiments across the entire customer journey, not just the top of the funnel, to produce outcomes that compound over time. Amplitude frames it as a data-driven, experiment-based approach that optimizes the full customer journey rather than one stage of it. That distinction is the whole point: performance marketing usually stops at the click or the lead, growth marketing follows the customer through activation, retention, and referral.
Three disciplines get confused with growth marketing constantly, and the boundaries matter for how you staff and budget:
- Performance marketing optimizes paid acquisition channels for cost per acquisition and return on ad spend. It’s a subset of growth marketing, not a replacement for it.
- Demand generation builds pipeline and awareness, often in B2B contexts, and typically hands off to sales rather than owning retention or expansion.
- Brand marketing shapes perception and long-term equity, usually without the tight feedback loops or weekly experiment cadence that define growth work.
Growth marketing borrows from all three but reports to a different scoreboard: retention curves, activation rates, and referral loops sit next to acquisition cost on the same dashboard.
The mental model shift that matters most is moving from a funnel to a flywheel. A funnel treats growth as linear: traffic in, customers out, repeat. A flywheel treats customer outputs, referrals, reviews, usage data, and user-generated content, as fuel that gets reinvested into acquisition. As one framing puts it, the goal is to treat the system as a flywheel rather than a funnel, where every rotation makes the next one easier and cheaper. That’s the practical difference between a marketing growth strategy that plateaus and one that keeps building momentum on its own.
The Frameworks Worth Knowing (and When to Use Each)
Every growth team eventually encounters the same five or six frameworks. The trick isn’t picking a favorite. It’s knowing which one solves which problem, because most of them aren’t competing, they’re complementary.
- AARRR (Pirate Metrics): Acquisition, Activation, Retention, Referral, Revenue. This remains the best diagnostic tool for mapping where a customer journey is leaking, and CXL frames it as a practical structure for locating your biggest opportunity before you touch a single campaign.
- ICE Scoring: A prioritization method that ranks experiment ideas by Impact, Confidence, and Ease, each scored 1 to 10, then averaged or multiplied to rank a backlog. This is how you decide what to test first, not where the problem lives.
- Bullseye Framework: A channel-discovery method that has teams brainstorm every possible acquisition channel, run small cheap tests across a handful, then concentrate spend on the two or three that show real traction.
- RACE (Reach, Act, Convert, Engage): A planning structure popular in digital marketing strategy work that maps activities to funnel stages across a full year, useful for teams that need a shared planning vocabulary across departments.
- G.R.O.W.S. Process: Gather ideas, Rank them, Outline experiments, Work (execute), Study results, then loop. It’s essentially a lightweight operating cycle for running the experimentation engine itself.
- Flywheel Model: Less a framework and more a philosophy, it reframes retained and referring customers as an acquisition channel rather than a cost center.
The mistake most teams make is treating these as rivals and picking one to rule them all. They’re not interchangeable, they’re layered. Use AARRR to diagnose where the funnel is leaking. Use Bullseye when you genuinely don’t know which channels deserve a real test. Use ICE once you have a backlog of experiment ideas and need to sequence them. Use the flywheel model once you have enough retained customers that referral and content loops start to matter more than paid reach.
Pro Tip: Don’t run a Bullseye channel test and an ICE prioritization exercise on the same idea list at the same time. Bullseye picks channels. ICE picks experiments within a channel you’ve already chosen. Mixing the two stages produces a backlog that looks busy but goes nowhere.
How to Build Your One-Page Growth Framework
Most teams don’t need a 40-slide strategy deck. They need a single page they can pin above their desk and actually follow. Here’s the five-step process to build one.
Step 1: Set your North Star metric and 3 to 5 input metrics.
Your North Star is the one number that best reflects the value you’re delivering to customers, and it should move when the business is genuinely healthy, not just when you spend more on ads. For a SaaS company, that’s often weekly active accounts or activated seats. For an eCommerce growth strategy, it’s typically repeat purchase rate or contribution margin per customer. For a marketplace, it’s usually completed transactions on both sides of the platform. Beneath that North Star, pick 3 to 5 input metrics you can directly influence, things like activation rate, checkout completion, or email opt-in rate, that logically feed into the bigger number.
Step 2: Clarify your ICP and UVP before you touch channels.
You cannot pick channels intelligently without knowing exactly who you’re selling to and why they’d choose you over the alternative. Write your ideal customer profile down as a specific, falsifiable description, not a vague persona. Pair it with a one-sentence unique value proposition that a stranger could repeat back after reading your homepage once.
Step 3: Use the “Four Fits” to choose 2 to 3 channels.
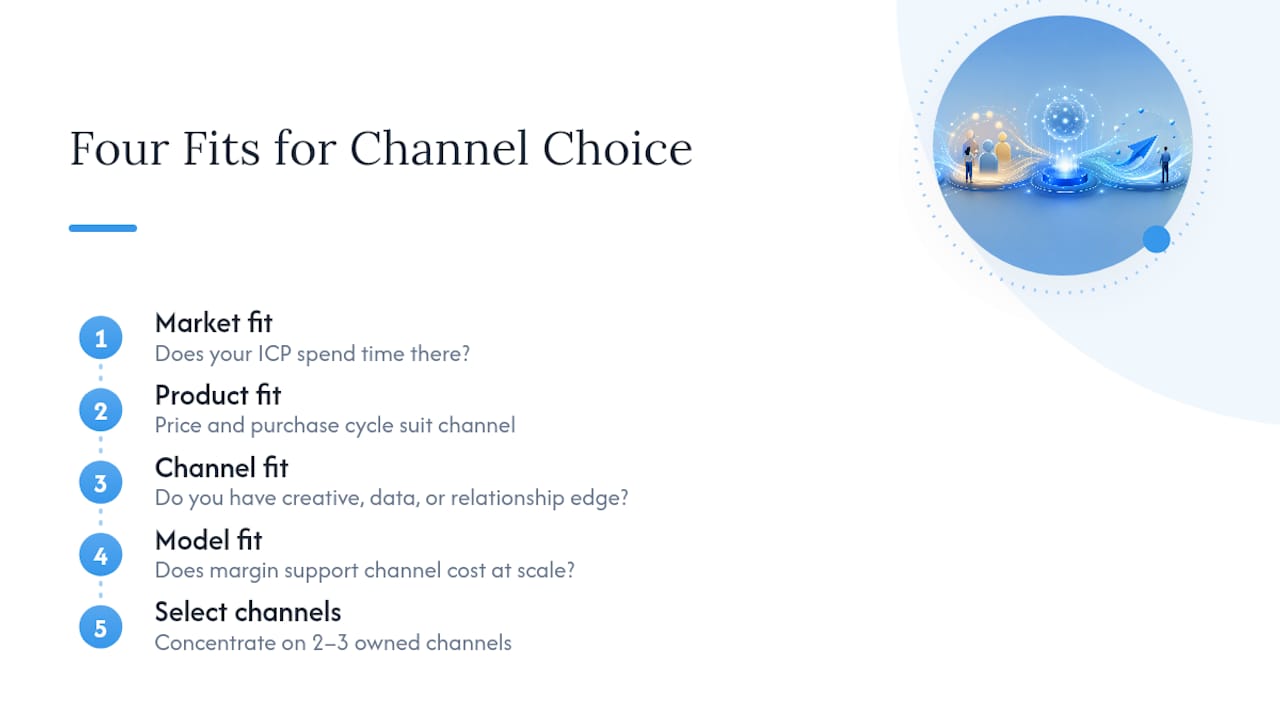
Structural advantage beats channel novelty every time. Map your options against four fits: market fit (does your ICP actually spend time there), product fit (does your product’s price point and purchase cycle suit that channel’s buying behavior), channel fit (do you have a creative, data, or relationship edge competitors don’t), and model fit (does your margin support that channel’s cost structure at scale). Most successful growth programs concentrate on a single North Star metric paired with 2 to 3 owned channels rather than spreading thin across five or six. If you’re weighing organic against paid, a practical guide to organic growth strategy is worth reading before you commit budget either way.
Step 4: Define owners, roles, and cadence.
Assign a RACI for your framework: who’s Responsible for running experiments, who’s Accountable for the North Star moving, who needs to be Consulted before a channel gets more budget, and who just needs to be Informed of results. Most growth programs don’t stall because the strategy was wrong. They stall because the execution layer, owners, tooling, cadence, was never built, and that gap is usually the real strategic bottleneck.
Step 5: Draft the one-page document.
Put your North Star at the top, your 2 to 3 channels beneath it, your current quarter’s OKRs beneath that, and a live experiment pipeline at the bottom with hypothesis, status, and result columns. That single page becomes the artifact every planning meeting, every review, and every new hire orientation refers back to. Messaging tests that touch activation and retention often surface here too, and a solid conversion copywriting approach can sharpen exactly the kind of voice-of-customer experiments this document is built to track.
Running Experiments That Actually Produce Decisions
Most experiment backlogs die of ambiguity, not bad ideas. A test runs, the numbers come back mixed, and the team argues about what it means instead of already knowing. The fix is a template that forces clarity before launch, not after.
Every experiment card should include these fields, filled in before you write a single line of ad copy:
- Hypothesis: A specific, falsifiable statement, “If we shorten checkout from 4 steps to 2, completion rate increases,” not “let’s improve checkout.”
- Funnel stage: Which AARRR stage this experiment targets, so you know if you’re solving an acquisition problem or a retention one.
- Primary metric: The single number that determines success. Not five metrics, one.
- Duration: A fixed end date set in advance, not “until it feels done.”
- Minimum detectable effect (MDE): The smallest change worth caring about, set before the test starts.
- Sample size rule of thumb: A rough calculation of how much traffic or how many users you need to trust the result.
- Decision rule: What happens if the test wins, loses, or lands inconclusive, written down before you see any data.
That last field is the one almost everyone skips, and it’s the one that matters most. A disciplined experiment includes pre-committed decision rules for exactly this reason: teams that decide in advance what a win, loss, or inconclusive result means don’t waste weeks debating afterward. Skipping the MDE and decision rule is a well-documented cause of noisy tests that never actually change behavior, because without them, any result can be argued into meaning whatever the loudest person in the room wants it to mean.
Statistic callout: ICE scoring, impact, confidence, and ease, each rated on a simple scale, gives you a fast way to rank a crowded backlog without a lengthy debate over every single idea. Multiply or average the three scores, sort descending, and start at the top.
Once results come in, the discipline continues. Winners get scaled deliberately, not immediately maxed out. Losers get archived with their learnings, not deleted. Inconclusive results get a second, better-powered test or get shelved entirely, they don’t get treated as evidence either way. A team running structured creative experiments on a consistent cadence tends to build a much clearer picture of what actually drives their North Star than one running scattered, unstructured tests whenever someone has a spare afternoon.
Planning Cadence and Governance That Prevents Stalling
A framework on paper does nothing without a rhythm that forces it into practice. Here’s the minimum planning structure that keeps experiments shipping instead of sitting in a backlog.
- Set quarterly OKRs tied directly to the North Star. If your North Star is repeat purchase rate, your key results might be “ship 6 retention experiments” and “increase email-driven repeat purchases by a defined target,” not vague aspirations.
- Hold a weekly experiment review. Fifteen to thirty minutes, same day every week, attended by whoever owns execution. Review what launched, what’s running, and what needs a decision this week.
- Hold a monthly strategic review. This is where leadership looks at input metrics, not just experiment status, and decides whether the channel mix or North Star itself needs adjusting.
- Name a single decision authority per channel. Committees don’t kill bad experiments fast enough. One accountable owner per channel does.
- Build in a stop rule for underperforming channels. Decide in advance what a channel has to fail to do before you cut its budget, so that decision isn’t made emotionally three quarters too late.
The most common governance pitfall isn’t a lack of ideas, it’s a lack of owners. An experiment with no named owner doesn’t run. A channel with no accountable decision maker never gets cut, even when it should. Fixing this rarely requires new tools. It usually just requires writing a name next to every line item on your framework document and holding that person to the weekly cadence, without exception.
Metrics, Dashboards, and Attribution Without the Bloat
The clearest measurement systems use three layers, and nothing more: one North Star, 3 to 5 input metrics, and a set of experiment-specific metrics that live inside individual test cards. Amplitude recommends restricting dashboard visibility by cadence, a weekly executive summary with just 1 to 2 metrics, a monthly tactical view with the 3 to 5 inputs, and an experiment vault where test-level data gets archived for later reference.
Applied by business type, that looks like this:
| Business type | North Star | Sample input metrics |
|---|---|---|
| SaaS | Weekly active accounts | Activation rate, trial-to-paid conversion, churn |
| eCommerce | Repeat purchase rate | Checkout completion, average order value, email opt-in rate |
| Marketplace | Completed transactions | Supply-side listings, demand-side searches, match rate |
Dashboards should stay boring on purpose. Executives need one page they can read in ninety seconds. Teams running experiments need a live backlog view showing status, owner, and result, updated weekly, not reconstructed from memory before a meeting.
On attribution, resist the pull toward complexity before you’ve earned it. UTM parameters and clean event tracking solve most attribution needs for teams under a certain scale. Multi-touch attribution models add real value once you’re running paid, organic, and lifecycle campaigns simultaneously at meaningful volume, but bolting one on too early usually just adds noise nobody has time to interpret. If your current setup can’t answer “which channel drove this signup” with a straight face, fix that before you touch anything more advanced. A well-built marketing dashboard aligned to the right KPIs usually solves more attribution confusion than a new tool ever will.
Pro Tip: If a metric doesn’t change how someone acts in the next seven days, it doesn’t belong on a weekly dashboard. Move it to the monthly view or cut it entirely.
When to Scale a Winner and Build the Flywheel
Not every winning test deserves an immediate scale-up. Before you commit real budget, check three things: statistical confidence in the result, whether the effect size is large enough to matter commercially, and what it actually costs to scale the win versus what you gained in the test.
A test that lifted conversion by half a percentage point on a small sample might be real, but scaling it might cost more in ad spend or engineering time than the lift is worth. A test that doubled referral rate on a small cohort, on the other hand, is worth scaling even with a wider confidence interval, because the upside dwarfs the risk.
Operationalizing the flywheel means deciding, concretely, where retained customers, referrals, and content reinvest into acquisition:
- Referral programs turn satisfied customers into a paid-adjacent acquisition channel with a lower cost basis than most ad platforms.
- Product changes that improve retention shrink the leaky bucket, meaning every dollar spent on acquisition keeps working longer.
- User-generated content and reviews become creative assets that improve paid performance, closing the loop between retention and acquisition.
Watch for diminishing returns as the signal to reallocate. If a scaled channel’s cost per acquisition climbs while conversion holds flat, that’s not a signal to spend harder, it’s a signal to shift the next round of experiments to a different bottleneck. A team that once needed to scale paid social without wrecking ROAS often finds the better fix isn’t more budget, it’s redirecting effort toward the retention or referral side of the flywheel instead.
Proof This Framework Works: The FACEGYM Result
Frameworks are only as good as what they produce. Vertical Brands applied this exact operating model, one North Star, a focused channel set, and a disciplined experiment cadence, with FACEGYM, and the integrated approach combining creative and performance work drove a 50% increase in purchases and a 41% rise in bookings. That result maps cleanly onto the steps above: a clear metric to target, a narrow channel focus, and creative experiments run with enough rigor to know what actually worked.
The gap between a growth marketing framework that sits in a slide deck and one that moves a business is almost always execution discipline, not strategic brilliance. The teams that win pick fewer things and do them with more rigor.
For a team starting from zero, the first month looks like this:
- Week 1: Set your North Star, pull baseline numbers for your 3 to 5 input metrics, and document your current channel mix honestly.
- Week 2: Apply the Four Fits test to your channel list and cut it down to 2 or 3 with real structural advantage.
- Weeks 3 to 4: Draft your one-page framework document, assign owners, and load your first 4 experiments into the backlog with full templates filled in.
- Month 1 close: Run all 4 experiments to completion, apply your pre-written decision rules, and hold your first monthly strategic review.
Templates and Resources to Put This Into Practice
A framework only works once it’s written down somewhere your team actually opens. Start with the resources below, then decide where you need outside help versus where your team can move alone.
- Use a creative testing framework to structure your first experiment batch instead of testing ad variants at random.
- Pull KPI structure from a marketing dashboard guide built for analysts so your reporting layer doesn’t need a rebuild in six months.
- Review conversion copywriting techniques before writing your next round of activation or retention experiments.
- Study organic growth strategy fundamentals if your channel mix leans too heavily on paid acquisition.
- Reference paid social scaling guidance once your first winning channel is ready for more budget.
Small teams, under ten people, should focus entirely on step 1 through 3 of the build process before touching a formal governance calendar. Mid-size marketing teams with dedicated growth staff can move straight to the full quarterly cadence. Larger organizations juggling multiple product lines usually get the most value from bringing in outside structure early rather than building the operating model from scratch internally. If that’s where you are, Vertical Brands works directly with teams to build and run this exact framework, from strategy through creative and performance execution, so the model doesn’t just get documented, it gets operated.
What This Framework Gets Right (and Where Most Advice Goes Wrong)
Most growth marketing content oversells the framework and undersells the discipline behind it. AARRR, ICE, Bullseye, none of these are secrets. What separates teams that grow from teams that stay busy is whether anyone actually writes the decision rule before the test launches, and whether anyone’s job depends on the North Star moving.
The conventional advice tells you to “test everything.” That’s backwards. Test the bottleneck. A team running eight experiments across five channels with no clear priority order is doing theater, not growth marketing. Pick the 2 to 3 channels with structural advantage first. Everything else is a distraction dressed up as ambition.
If you take one thing from this framework, take the one-page document. Not the frameworks survey, not the metric hierarchy diagram, the single page with a North Star, a channel list, and a live experiment pipeline. Teams that build that page and actually update it weekly outperform teams with more sophisticated strategy decks and no working document at all. Strategy that lives in someone’s head isn’t a framework. It’s a guess with better vocabulary.
— Alex
Sources
- The Comprehensive Guide to Growth Marketing
- How to Create a Marketing Growth Strategy - CXL
- Intuit QuickBooks SMB annual report (Insights 2025)
Recommended

Other posts


































































Stay ahead with better decisions.
Get business insights today.
